Blog Post
What Is Downtime? A Thorough Overview and How to Reduce It
Whether planned or not, downtime costs your business. Learn what downtime is and how to cut down on unplanned stops to keep your processes running smoothly.



Key Takeaways
Downtime costs more than lost revenue. A baseline estimate takes into account hourly revenue, fully loaded labor cost, idled employees, SLA penalties, and estimated churn cost.
Downtime and idle time are different concepts. Downtime means an asset is incapable of functioning, while idle time means it's operational but not producing due to scheduling or demand gaps. Tracking them separately prevents distorted OEE scores and misallocated maintenance budgets.
The reputational cost of downtime often outlasts the technical incident. Negative work-of-mouth spread can damage a company long after the system is back online.
A single hour of downtime can quietly cost a company more than most budgets account for. It's not just obvious issues like a stalled production line or a frozen checkout page. What really hurts is the idle labor, the missed SLA, the customer who never comes back, and the reputational hit that keeps compounding long after the system is back online.
For operations and maintenance teams, understanding downtime is both a technical and financial exercise. This guide breaks down what downtime actually is, what causes it, how to calculate its true cost, and what teams can do to reliably reduce it with data.
What Is Downtime?
Downtime is any period when a system, machine, or service is unavailable or non-operational. The term applies broadly across IT infrastructure, cloud-based services, and physical assets like commercial HVAC systems, fleet vehicles, and production lines.
You can measure it by quantifying the gap between the onset of failure and full service restoration, which is why accurate timestamp logging is critical. Even brief outages can trigger cascading failures across dependent systems and workflows, turning a localized problem into an organization-wide one.
Teams that use a connected CMMS can log failure onset automatically through real-time asset monitoring, creating an accurate record for key benchmark calculations and future prevention.
The Difference Between Planned and Unplanned Downtime
Not all downtime works the same, which is why treating each type differently is important for proper management:
Planned downtime is scheduled in advance for maintenance, upgrades, or system migrations, giving stakeholders time to anticipate and minimize disruption. Because it's scheduled, teams can stage parts, notify vendors, and coordinate labor well ahead of time.
Unplanned downtime occurs without warning due to equipment failures, cyberattacks, or external events, forcing a reactive response under pressure. It allows for none of the advance coordination of planned downtime.
Organizations should track both types separately in their CMMS to accurately benchmark reliability improvements over time. Combining them obscures whether prevention efforts are actually working, because a spike in total downtime could simply reflect more scheduled maintenance rather than declining reliability.
What Causes Downtime? The Most Common Triggers
Downtime rarely has a single cause, but a handful of triggers show up again and again:
Hardware failure like disk crashes, motor burnout, server overheating. It's a leading cause of downtime but is usually preventable with condition monitoring.
Software bugs, failed patches, and misconfigured updates are particularly common in organizations without change management protocols.
Cyberattacks such as ransomware and DDoS campaigns, which can take systems offline for days. Ransomware alone results in about 24 days of downtime per incident.
Human error includes accidental deletions, incorrect configurations, or skipped inspection steps. It's one of the most common causes of downtime, but also the most directly addressable through process standardization.
Natural disasters and power outages often occur in facilities without redundancy plans. These face the longest recovery windows when physical infrastructure is disrupted.
Lack of preventive maintenance visibility is when teams don't know an asset's service history, so they can't anticipate failure.
UpKeep's Nova AI analyzes work order history and asset data to flag equipment at elevated failure risk before a breakdown occurs, helping teams shift from reactive to predictive maintenance.
The Business Impact of Downtime
The cost of downtime shows up in more places than most teams initially account for. Revenue loss hits immediately when customer-facing systems go offline. For eCommerce and SaaS businesses especially, even minutes of downtime during peak hours can lead to a large number of lost transactions.
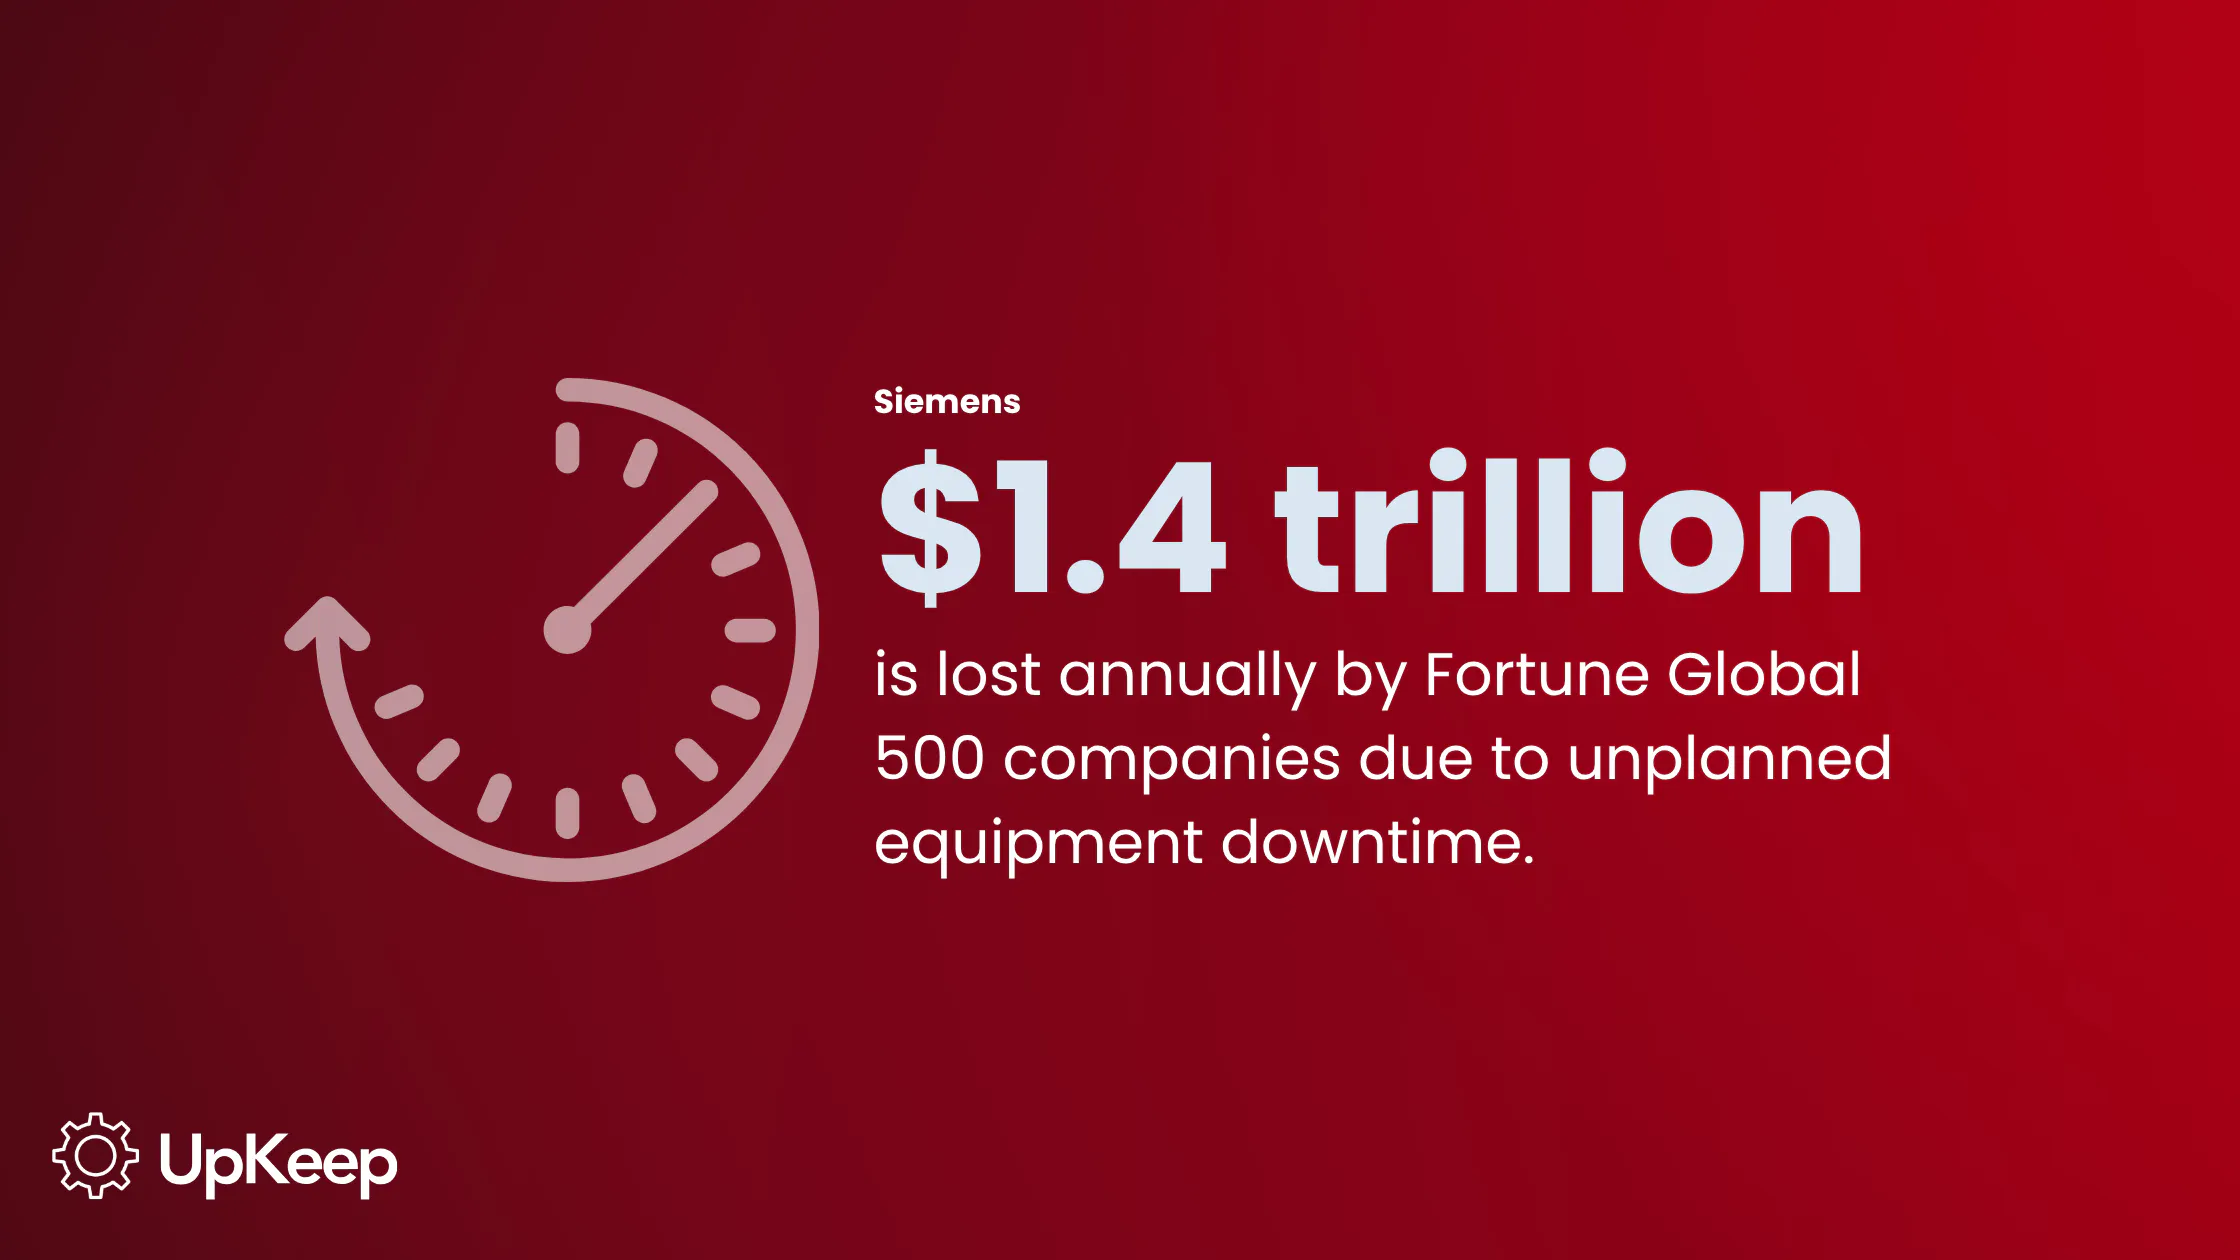
The scale of this problem is enormous, with Siemens reporting that Fortune Global 500 companies lose a combined $1.4 trillion annually to unplanned equipment downtime.


Employee productivity also drops when internal tools, databases, or communication platforms go down, and the effects extend beyond the outage window itself. Industry surveys reveal 39% of respondents said they had greater workloads after missing deadlines caused by downtime. If that burden is left unresolved, it can accumulate and erupt into team burnout over time.
Repeated outages also erode customer trust and accelerate churn. Customers who experience service failures are significantly more likely to evaluate competitors, even when the failure is resolved quickly.
Brand reputation damage from publicized outages can outlast the technical incident as well, especially with social media's ability to amplify response time failures in real time. Negative social media posts about that experience can spiral out of control, causing damage to a company that persists well after the underlying issue is fixed. In other words, while the technical incident might only last an hour, the reputational fallout can last much longer.
Regulated industries like healthcare, energy, and finance face an added layer of risk: compliance penalties when downtime interrupts mandatory data availability or safety monitoring systems. And the longer an outage extends past agreed-upon SLAs or contractual uptime thresholds, the greater the refund or service credit owed to clients.
How to Calculate the Cost of Downtime
Downtime costs vary widely by industry, company size, and the systems affected. Expenses broadly fall into two categories:
Direct costs: Lost sales, idle labor, emergency IT support, and SLA breach penalties
Indirect costs: Customer churn, long-term brand damage, and lost future contracts (these are harder to quantify, but they often exceed direct costs over time)
A baseline formula for estimating downtime cost:
(Hourly revenue of affected system) + (Fully loaded hourly labor cost × Number of idled employees) + (SLA penalties) + (Estimated churn cost based on historical retention data)
For manufacturing specifically, it's important to factor in scrap and rework costs from production runs interrupted mid-cycle. Those components rarely appear in generic downtime cost models but can add up quickly on the shop floor.
Take a production line at an automotive parts manufacturer as an example. It goes down for four hours due to a PLC failure. The cost inputs to calculate downtime for this scenario would include:
|
Component |
Calculation |
Cost |
|
Hourly revenue of affected system |
Line produces $12,000/hr in shippable output (based on units/hr × price per unit) |
$12,000 |
|
Complete labor cost |
22 idled line workers × $38/hour fully loaded (wages + benefits + payroll tax) |
$836 |
|
SLA penalties |
Just-in-time delivery contract with automaker OEM includes penalty clauses for late shipments |
$8,000 |
|
Estimated churn cost |
Historical data: Repeated late deliveries to this OEM correlate with ~5% chance of losing a portion of the contract next renewal cycle; contract worth $2M annually |
$2,000 (5% × $2M ÷ number of estimated future incidents, or actuarially weighted) |
Per-hour costs:
Revenue loss: $12,000 × 4 = $48,000
Labor cost: $836 × 4 = $3,344
One-time/Flat costs triggered by this specific outage:
SLA penalty: $8,000 (flat penalty for missing the delivery window)
Churn cost: $2,000 (risk-weighted estimate, not per-hour)
Total estimated downtime cost: $61,344
UpKeep's operational analytics dashboards allow maintenance managers to track downtime duration, frequency, and associated labor costs by asset. This builds the data foundation needed to make the downtime cost calculation in real time, rather than reconstructing it after the fact.
Downtime vs. Idle Time
These two terms are used interchangeably, but they describe distinctly different problems:
Idle time occurs when equipment is operational but not actively producing due to demand gaps, scheduling delays, or waiting on upstream processes.
Downtime means the asset is incapable of functioning at all. It's a reliability or maintenance problem rather than a scheduling one.
Confusing the two distorts overall equipment effectiveness (OEE) scores and leads to misallocated maintenance resources, such as investing in reliability improvements for an asset that's not actually broken but just idles by design.
Idle time is addressable through production scheduling; downtime requires a maintenance and reliability response, which typically involves different teams, budgets, and KPIs. Both should be tracked separately in your CMMS to give planners and reliability engineers an accurate picture of asset performance.
Key Metrics for Measuring Downtime
A few metrics form the backbone of any reliability program:
MTBF (mean time between failures): Measures average operational time between successive failures. A higher MTBF indicates more reliable assets.
MTTR (mean time to repair): Tracks how quickly teams restore service after a failure. A low MTTR reflects strong incident response, spare parts availability, and technician skill.
Availability percentage: The foundational metric for any reliability program.
|
Metric |
Formula |
|
Mean time between failures |
MTBF = Total uptime (hrs) ÷ Number of breakdowns |
|
Mean time to repair |
MTTR = Total downtime (hrs) ÷ Number of breakdowns |
|
Availability percentage |
Availability = (Uptime ÷ Total scheduled operating time) × 100 |
The "nines" model translates availability targets into real terms: 99.9% availability allows roughly 8.8 hours of downtime per year, while 99.99% allows only about 52 minutes. Tracking trend lines across quarters instead of looking at any single metric in isolation reveals whether reliability investments are actually producing measurable gains.
UpKeep's customizable dashboards display MTBF, MTTR, and availability metrics by asset, location, or team, giving reliability engineers and operations leaders the trend data they need to act accordingly without manual spreadsheet aggregation.
Strategies for Operations Teams to Reduce Downtime
Reducing downtime is usually a combination of smaller structural changes that reinforce each other over time. Each tactic below addresses a different point of failure, from infrastructure design to human behavior. Together, they form a layered defense against unplanned outages.
Implement Redundant Systems and Automatic Failover
Redundancy entails designing systems so that no single component's failure can take down the entire operation. This starts with inventorying every asset, server, or process and asking what happens if it fails right now. Any answer that involves stopping everything flags a single point of failure that needs a backup path.
Automatic failover takes redundancy a step further by removing the need for manual intervention. When a primary system goes down, traffic, workloads, or production automatically reroute to a backup system, which minimizes the gap between failure and recovery.
Example in practice: A regional food distributor runs its inventory management system on a primary server with a standby replica in a separate facility. When the primary server's power supply fails during a storm, the standby takes over within seconds, and the warehouse team never notices an interruption to order fulfillment.
Schedule Regular Backups and Verify Recoverability
Backups are only useful if they actually restore data when needed. Many organizations schedule automated backups but never test if they can be recovered cleanly, which means a corrupted or incomplete backup often isn't discovered until it's needed in an emergency.
Recovery drills should simulate a real failure scenario. That includes measuring how long a full restoration takes, since that duration directly affects recovery time objectives (RTOs).
Example in practice: A regional hospital network runs quarterly disaster recovery drills where IT restores patient records from backup onto an isolated test environment. During one drill, they discover a backup job had been silently failing for two weeks due to a permissions error, an issue that would have been catastrophic to find during an actual outage.
Deploy Real-Time Monitoring and Alerting
Monitoring systems track the health of equipment, software, or infrastructure continuously, flagging anomalies before they escalate into full outages. The key to effective monitoring is calibrating alert thresholds to asset criticality rather than relying on default settings, since a threshold that’s too sensitive drowns teams in false alarms, while one too lax lets real problems slip through.
This is where predictive maintenance technologies add the most value. Sensors that track vibration, temperature, and other condition indicators feed into machine learning models that can flag equipment at elevated risk of failure before a breakdown actually occurs. Rather than reacting to a failure after it happens or replacing parts on a fixed calendar schedule regardless of actual condition, predictive maintenance lets teams intervene based on real asset health data.
UpKeep's Nova AI, for example, analyzes historical work order and asset data to surface equipment showing early warning signs, helping teams shift from a reactive or purely preventive posture to a genuinely predictive one.
Example in practice: A beverage bottling plant installs vibration sensors on its filling line motors. The predictive maintenance system then flags an unusual vibration pattern on one motor two weeks before it would have failed outright. That gives the maintenance team time to schedule a replacement during an already-planned changeover instead of during a costly unplanned stoppage.
Train Staff on Change Management Procedures
Most configuration-related human errors happen during routine updates, so change management training is a smart investment. A formal change management process encompasses documented approval steps, peer review of changes before deployment, and a clear rollback plan if something goes wrong.
Training should go beyond a one-time onboarding session. Regular refreshers, especially after a near-miss incident, help reinforce why the process exists.
Example in practice: An IT team at a mid-size retailer previously allowed any engineer to push configuration changes directly to production. After a routine update accidentally took down the point-of-sale system during a holiday sales weekend, the team implemented a mandatory peer review and staged rollout process, cutting configuration-related outages by more than half the following year.
Develop a Business Continuity and Disaster Recovery (BCDR) Plan
A business continuity and disaster recovery plan documents exactly what happens when a major disruption occurs, including clearly assigned roles and responsibilities, contact trees, and recovery time objectives (RTOs) per system. Without this documentation, even a well-trained team can waste critical time figuring out who's responsible for what during an actual crisis.
Treat the BCDR plan as a living document and revisit it whenever the organization adds new systems, changes vendors, or experiences an incident that reveals a gap in the existing plan.
Example in practice: A logistics company's BCDR plan designates a specific incident commander for any system outage lasting more than 30 minutes, along with a pre-approved communication template for notifying customers. When a regional data center outage takes down their tracking portal, the incident commander role prevents the confusion that would otherwise come from multiple managers giving conflicting instructions.
Standardize Checklists and Work Order Workflows
Standardized inspection checklists reduce the variability in how different technicians identify and report early failure signs. Without a consistent checklist, one technician might catch a warning sign that another would miss entirely, simply based on experience or attention to a particular subsystem that day.
Work order workflows should be structured so inspection findings translate directly into actionable, trackable tasks rather than getting lost in informal notes or verbal handoffs.
Example in practice: A commercial HVAC service company standardizes its rooftop unit inspection checklist across all technicians, requiring specific readings (like refrigerant pressure, belt tension, and filter condition) to be logged at every visit. Six months in, the consistent data reveals a pattern of early belt wear across units from a specific manufacturer, which allows the company to proactively replace belts on similar units before they fail in the field.
UpKeep's mobile-first platform allows field technicians to log issues, complete inspections, and escalate work orders from the floor in real time. That reduces the lag between a technician spotting a problem and a work order actually being created.
But none of these strategies are one-and-done tasks. As more downtime and asset data accumulates, teams should revisit their thresholds, checklists, and RTOs to reflect what the data shows. This develops a continuous feedback loop that avoids treating downtime reduction as a project with a fixed end date.
Turn Downtime Data Into a Competitive Advantage
Downtime expenses ripple across revenue, labor, compliance, and brand trust long after a system comes back online. To mitigate these risks, organizations must measure it accurately, calculate its true cost, and use that data to keep improving. Start by tracking your downtime and idle time separately, calculate your baseline cost using the formula outlined above, and then build the monitoring habits that’ll turn every incident into a lesson that prevents recurrences.
Ready to slash your downtime and save your team money and headaches? Talk to UpKeep about how our connected asset monitoring and predictive maintenance solutions can help you catch failures before they become costly outages.
Frequently Asked Questions About Downtime
What is the difference between downtime and an outage?
"Outage" typically refers to a specific, discrete event, such as a server crash or a network failure at a particular moment. It contributes to overall downtime, and a single asset can experience many outages that together make up its total downtime for the month, quarter, or year. "Downtime" is the broader measurement of total unavailable time, often aggregated across multiple outages over a reporting period.
What are the most common causes of downtime?
Hardware failure, software bugs and failed updates, cyberattacks such as ransomware and DDoS attacks, and human error like accidental deletions or skipped inspection steps are among the leading causes. Natural disasters and power outages also contribute, particularly in facilities without redundancy plans. A lack of preventive maintenance visibility rounds out the list, because teams without accurate service history data can't anticipate failures before they occur.
How does downtime affect OEE?
Downtime directly reduces the availability component of overall equipment effectiveness. Every hour an asset is down is an hour it can't contribute to output, quality, or performance scores. Unplanned downtime is especially damaging to OEE trend accuracy if it isn't tracked separately from idle time, since the two get conflated and lead teams to misdiagnose whether reliability or scheduling issues are dragging the number down.
What is the best way to prevent unplanned downtime?
There's no single fix, but a combination of predictive maintenance, standardized change management, and redundant systems can prevent unplanned downtime the most. Predictive maintenance uses condition monitoring and historical failure data to catch problems before they cause a breakdown. Change management reduces configuration-related human error. Redundant systems and automatic failover ensure that when something does fail, the impact is contained.
What is MTBF and how is it used to measure downtime?
Mean time between failures measures the average time an asset runs between successive failures. It's calculated by dividing total uptime by the number of breakdowns over a given period. A higher MTBF signals a more reliable asset that requires less frequent intervention, while a declining MTBF is often an early warning that an asset is approaching the end of its useful life or needs a closer look from the maintenance team.
4,000+ COMPANIES RELY ON ASSET OPERATIONS MANAGEMENT
Leading the Way to a Better Future for Maintenance and Reliability
Your asset and equipment data doesn't belong in a silo. UpKeep makes it simple to see where everything stands, all in one place. That means less guesswork and more time to focus on what matters.






![[Review Badge] Gartner Peer Insights (Dark)](https://www.datocms-assets.com/38028/1673900494-gartner-logo-dark.png?auto=compress&fm=webp&w=336)