Blog Post
Reduce Downtime in Manufacturing: A Line-Level Playbook
Reduce downtime in manufacturing by ranking losses by production impact: Find the constraint, cut changeover time, standardize work across shifts.



Key Takeaways
Process design can amplify downtime even when equipment reliability is improving. Tightly coupled steps, unclear escalation paths, and shift-to-shift variation can keep causing stops on their own, which is why the equipment side alone doesn't always fix the recurrence.
Fault frequency alone doesn't identify a line's biggest downtime driver. Start with the line's actual constraint, then rank stops by their effect on total throughput.
Changeover time is a practical place to look for recoverable planned production time. Separating setup tasks that need a stopped machine from tasks that don't can recover it without an equipment reliability project.
Standard work can remove shift-to-shift variation without requiring new equipment. Some recurring stops persist simply because crews respond to the same condition differently, and closing that gap directly addresses a cause that's easy to overlook.
Manufacturing downtime can keep showing up in the same place every month, even with a maintenance program that’s up to service date. A changeover may run twice as long as it should, one station blocks three others the moment it hiccups, and a shift down the line handles the same fault differently than the crew before it. None of that shows up as a broken part, so none of it gets marked on a maintenance log.
Failure counts only answer which asset stopped and how often. They miss which stop costs the line the most. These two questions rarely point to the same asset, so you have to really dig into your data to hone in on where downtime is most expensive and how to slash that rate.
What Counts as Downtime on a Production Line
Downtime splits into two categories: Planned downtime is any stop a plant chooses and schedules in advance, such as changeovers, routine maintenance, and the like. Unplanned downtime covers everything else, from a part failing or a fault tripping a stop to a process drifting out of spec and forcing a hold.
Which OEE convention a plant uses affects how planned stops are counted. Some exclude certain scheduled shutdowns from planned production time entirely and don’t count them as downtime. So, before you delve into cutting down on downtime, you need to determine which type of stops you’ll cover and which you won’t.
On a single machine, that split is straightforward to track, but on a production line, it misses something important: A line is a sequence of dependent stations, and a stop at one station rarely stays contained to that station.
The Real Cost of Downtime in Manufacturing
When a station stops, every downstream station eventually runs out of work, and every upstream station has nowhere to put what it makes. However many stations it touches, that’s still one stoppage for the line. The number that grows is impact: lost throughput, idle labor standing at stations with nothing to work on, work-in-process piling up in the wrong places, and the startup losses that come with restarting a line that just idled.
How much of that impact actually manifests depends on how tightly the line is coupled and how much work-in-process sits between stations.
Hewlett-Packard's Eclipse printer assembly line is a classic case: Built with almost no buffer space between stations, it transmitted a stop at any single station to the rest of the line almost immediately. Adding buffer capacity at specific points enabled downstream stations to keep running through short upstream stops, recovering production capacity at the cost of a modest increase in inventory.
So, two plants can log an identical two-minute stop and see very different production losses. The difference comes down to how much buffer sits between stations: enough, and a stop stays contained; too little, and it spreads to the rest of the line.
How to Reduce Downtime in Manufacturing
When chronic mechanical failures dominate downtime, fixing the equipment is the obvious starting point. Preventive and predictive maintenance reduce those failures, but event frequency alone doesn’t reveal where the line loses the most output. After all, a short stop at the line constraint might disrupt production more than several longer stops somewhere else.
Consider two machines on the same line. Machine A stops six times per shift for two minutes each, while Machine B stops once for eight minutes. A report based on event count points to Machine A as the main problem. But if buffer capacity absorbs Machine A’s stops while Machine B sits at a station whose lost time directly limits output, Machine B ends up causing greater production loss. Failure frequency identifies recurring faults, while production impact shows where an intervention could recover the most output.
Reducing manufacturing downtime requires accurate stop reasons, protection around the line constraint, shorter changeovers, a standardized recovery response, and measurements that show whether those changes improve total line output.
Find the actual constraint first
To hone in on the constraint, ask:
Which station limits how much the line can produce when everything's running normally? That’s the constraint in the strict sense, sometimes called the bottleneck station. It’s the ceiling on total output no matter what else improves.
Which failures cause the biggest production loss when they happen? A station can be perfectly reliable and still be the constraint, and a station that fails constantly can matter less than either one if the line routes around it easily.
Manufacturing systems research from the Journal of Cleaner Production points to three practical signals to help pinpoint a constraint. Look for:
The machine with the lowest isolated production rate (how many parts it makes per cycle on its own, independent of anything upstream or downstream)
The machine sitting downstream of whichever buffer holds the most work-in-process (a growing queue in front of a station signals that station can't keep up)
The machine whose output most affects the line's total production rate when it changes
None of these require sophisticated software to identify, but the third signal takes more analysis than the first two. It usually entails testing or modeling how a change at one station moves total output. Tracking queue buildup and per-station output across a representative stretch of production runs can reveal where throughput is being constrained.
Cut changeover time, but target the right one
Changeover time, the setup between running one product and the next, is one of the more recoverable sources of planned downtime. It’s often longer than it needs to be simply because nobody has broken it down into segments.
The foundational method here is SMED (Single-Minute Exchange of Die), developed by a Toyota production system engineer. SMED separates every changeover task into internal setup, work that can only happen while the machine is stopped, and external setup, work that can happen while it’s still running. The core move is converting as many internal tasks to external as possible. That could mean staging tooling ahead of time, prepping the next job’s materials during the current run, or swapping bolted fixtures for quick-release ones.
Not every changeover is worth attacking first though. A long setup on a station that the line can absorb without slowing down matters less than a short setup at the actual constraint. In fact, research from the IEEE Robotics and Automation Letters discovered that the setup whose reduction improves overall line production rate the most depends on the specific machine-and-product combination, largely independent of how long that setup takes on paper.
You should also measure more than the time between stop and restart. Research from Production Planning & Control actually says the real changeover window should be the time from when full production of the outgoing product stops to when the new product reaches its target output and quality rate. That usually includes ramp-up losses and slower-than-normal output for a while after restart, on top of the visible downtime in between.
Standardize how work gets done
Some recurring unplanned downtime is due to inconsistency in how different shifts respond to the same fault condition. One operator knows to check a specific sensor first, but another doesn’t and spends 10 extra minutes finding the same answer.
Documenting standard work removes that variation without touching a single piece of equipment. That includes the specific sequence a crew follows for routine checks, changeovers, and known fault conditions. Then, pair that with the visual management and continuous-improvement habits behind your total productive maintenance, marking normal operating ranges directly on equipment so a deviation is visible at a glance, to give every shift the same starting point for catching a problem before it becomes a stop.
Give every stop a clear escalation path
None of the above strategies works if a stop just sits there while someone figures out who’s supposed to respond. Every stoppage needs a defined path that outlines what the operator tries first, how long it takes before it escalates, who’s notified, and what’s logged if the standard response doesn’t resolve the issue.
That last step is easy to skip and can cause the most damage. A problem marked as "fixed, moved on," will stay unexplained and show up again. But an unresolved stop that’s logged with enough detail becomes the input for root cause analysis. That record makes it possible to investigate the cause and cut the odds of a repeat problem.
KPIs That Show Downtime Is Under Control
Tracking the right numbers turns, "We think this is working," into, "We can see it's working." Five metrics matter most for a line-level downtime effort.
|
KPI |
What It Tracks |
Direction |
Guidance |
|---|---|---|---|
|
Line-level OEE |
Availability, performance, and quality multiplied together, measured for the line as a whole |
Higher is better |
Defined as Availability × Performance × Quality. Calculate it at a defined line measurement point; averaging or multiplying individual machine OEE scores can misstate the line's real effectiveness |
|
Changeover time |
Elapsed time and, ideally, output loss from the last good unit of one run to the first stable good unit of the next |
Lower is better |
Track by product pair since some changeovers are inherently longer than others |
|
Average time between failures on a given asset |
Higher is better |
Rising MTBF on a specific asset can indicate PM or PdM investment is paying off |
|
|
Average time to restore a failed asset to service |
Lower is better |
Falling MTTR reflects faster diagnosis and easier parts access, not only faster wrenching |
|
|
Planned vs. reactive maintenance share |
Share of maintenance work that's planned versus emergency |
Generally, higher planned share is healthier |
Some reactive work is economically reasonable; the goal is a rising trend, not zero reactive work |
Don’t treat these metrics as separate checkboxes. Production-system metrics should be interconnected across levels of a system, and reading them together is where the real diagnostic value is. If MTBF improves on a specific asset but line OEE doesn’t move, that can indicate the improved asset isn’t the current constraint, or that another loss elsewhere on the line, changeover, speed, or quality, is offsetting the gain.
Check whether the improved asset affects the constraint first, then look at changeover loss, speed loss, and quality loss on other stations before deciding where to intervene next.
Putting This Into Practice
Where to start depends on how trustworthy your stop data already is. Getting this foundation right is hard, considering roughly 75% of organizations rely mostly on reactive maintenance, according to UpKeep.
If you fall into that category and your stops aren’t yet consistently categorized by cause, start there. You can’t prioritize problems correctly without knowing reliably what’s stopping the line and how often.
Once stop data is trustworthy, move to ranking losses by production impact and identifying the actual constraint, using the method discussed above. Once recurring losses are under control, the highest-value work shifts to changeover loss and standard work, since the foundational causes are handled and the remaining gains sit in planned downtime and process variation.
A CMMS can make this sequence easier to standardize, execute, and document across shifts. Digitized, mobile-accessible standard work and changeover checklists help every shift follow the same sequence regardless of who's on the floor, eliminating procedural inconsistency.
Layered on top is an escalation workflow that handles what standard work can’t: A stop is flagged, a standard response is attempted, and an unresolved stop gets logged for root cause analysis with a record of exactly why it happened. UpKeep’s Nova can turn that logged incident into a generated work order for review and approval. If your team runs high-volume, multi-system automation across ERP, SCADA, or other connected tools, you can configure this through SuperNova instead.


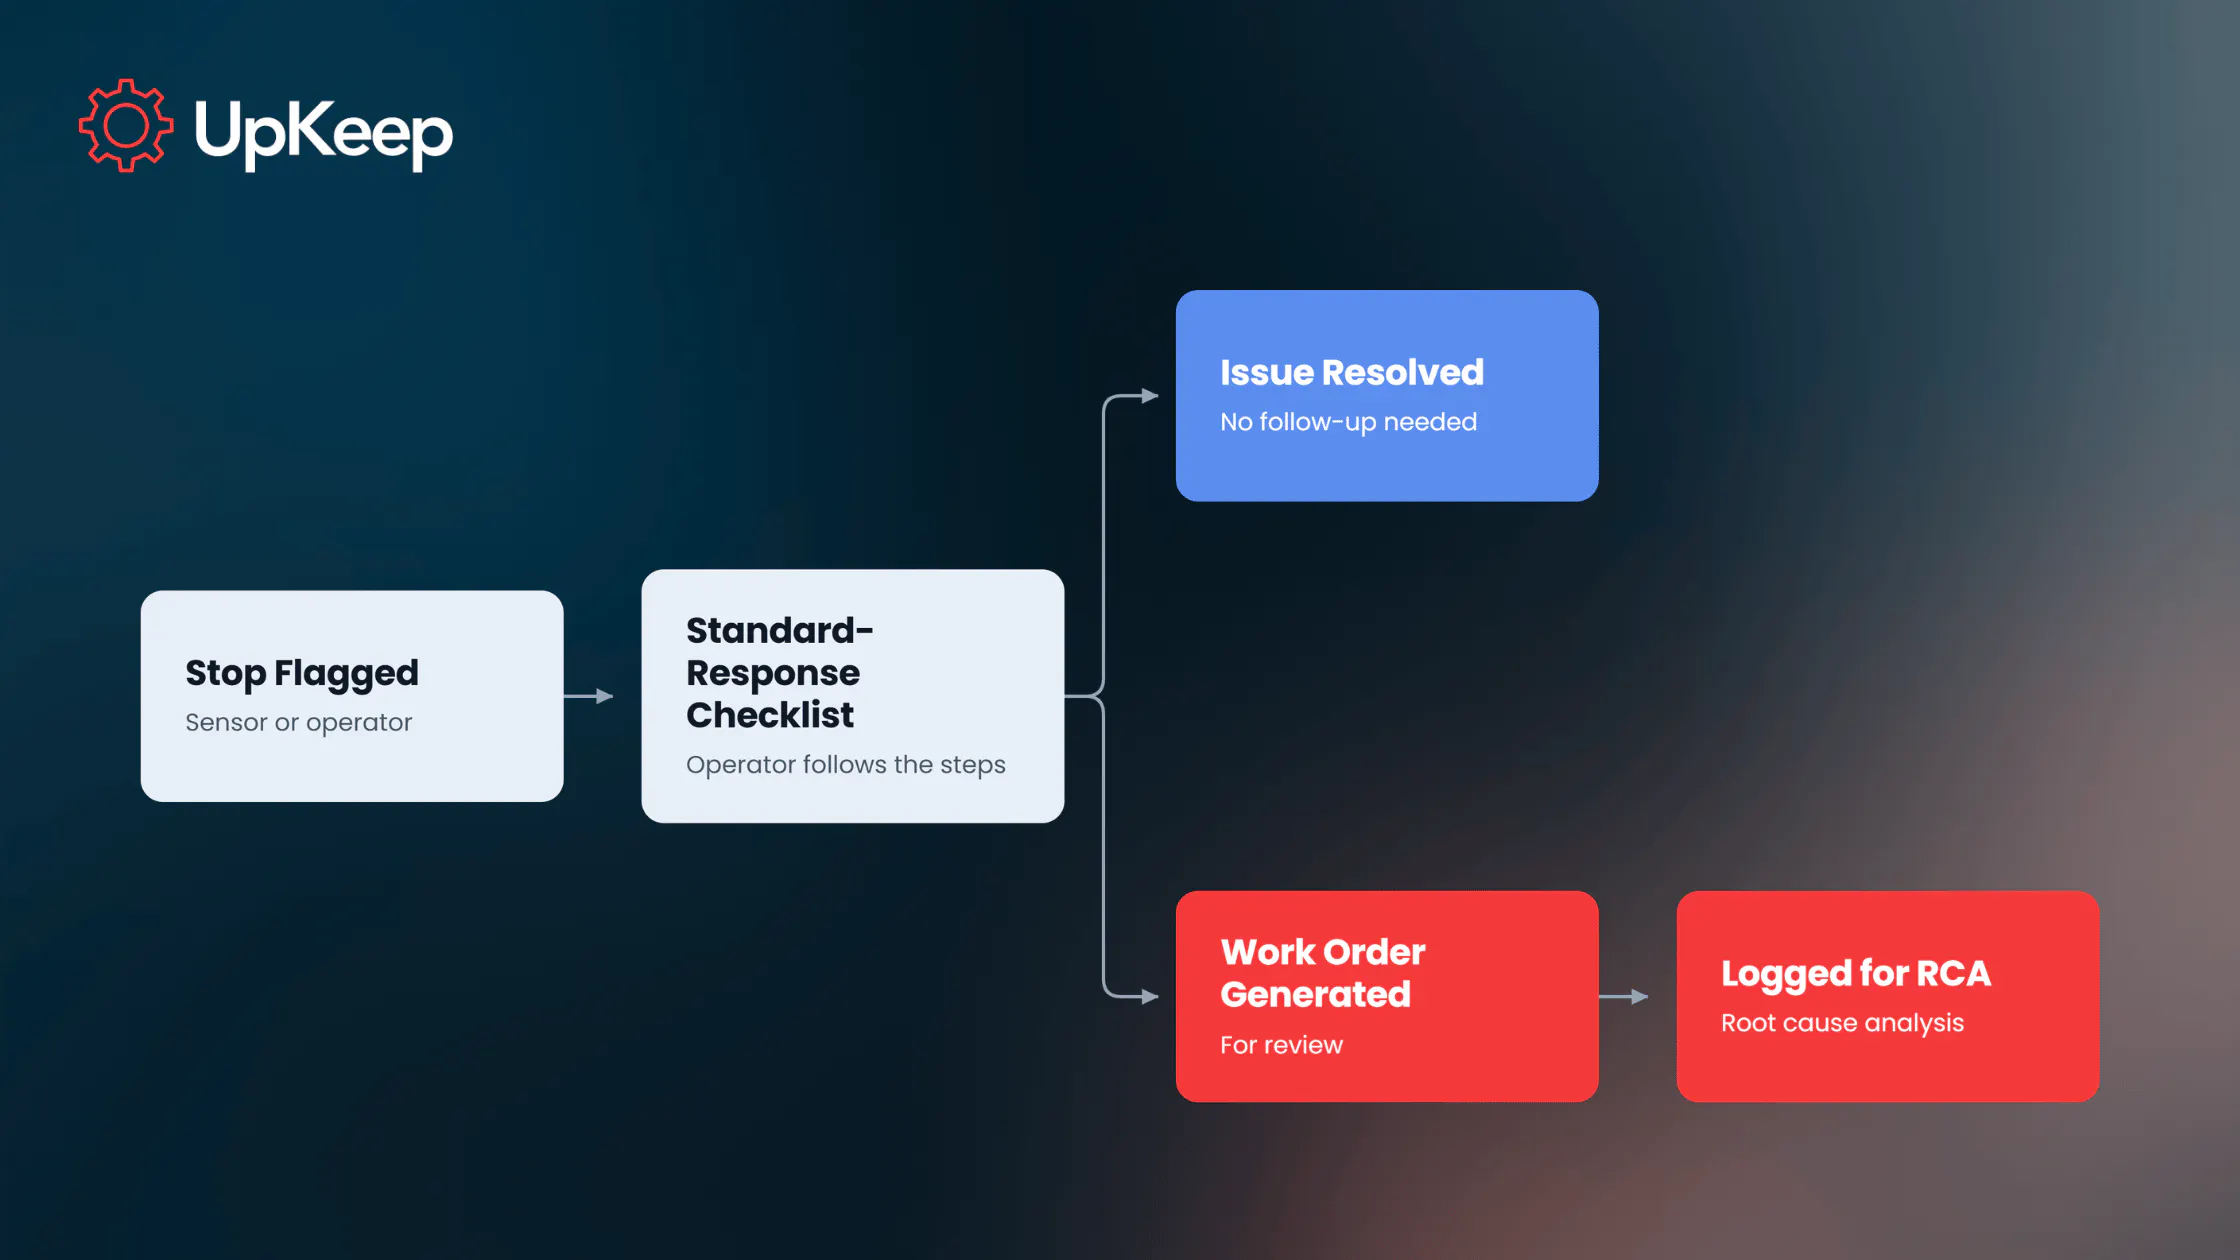
From Reactive to Controlled Production Line
An uncontrolled line sees stops cluster in the same three places every month and nobody can agree on why because the data shows fault count without showing production impact. Escalation then means whoever happens to be free when the line goes down. Every stop gets treated as a one-off issue, so the same pattern shows up again next quarter.
A controlled line, however, is more structured: Standard work is documented and followed the same way regardless of shift. Changeover time is tracked and shrinks, and every stop has a defined escalation path so nothing sits unaddressed while someone figures out who's responsible. Meanwhile, line OEE is trending in the right direction because the team fixes whichever station limits output.
Shifting from that first state to the second comes down to connecting a stop to a response automatically. Next month’s changeover time and line OEE numbers are the real test of whether or not it held. Start a free trial of UpKeep to see how a connected downtime workflow looks on your own production floor.
FAQ
What does it mean to reduce downtime in manufacturing?
Reducing downtime in manufacturing entails shrinking the time a production line isn't functioning by targeting the causes with the biggest effect on total output. That includes machine failures and slow changeovers. Those causes are often different from the ones that happen most often.
How do you calculate downtime in manufacturing?
The standard formula is downtime divided by planned production time, then multiplied 100 for a percentage. Here, downtime is any period equipment or the line was scheduled to run but couldn't. At the line level, there’s one caveat: A station that's starved or blocked also isn't producing, but that still only counts as one stoppage for the line.
What's the difference between a machine stopping and a line stopping?
A machine stopping is a single asset going down, while a line stopping is what happens next. Whether that failure ripples through the rest of the system depends on how tightly the line is coupled and how much buffer sits between stations. The same machine failure can be a non-event on one line and a full line stop on another.
How do you reduce changeover time on a manufacturing line?
To reduce changeover time, start with the SMED method: Separate every changeover task into work that requires the machine to be stopped and work that doesn't, then convert as much of the second category ahead of time as possible. Prioritize which changeover to attack first by its effect on total line output.
What KPIs show whether a downtime reduction effort is actually working?
The most relevant KPIs here are line-level OEE, changeover time, MTBF, MTTR, and the ratio of planned to reactive maintenance work. Be sure to read them as a connected set. For instance, an improving asset-level metric that doesn't move line OEE can mean the gain isn't reaching the line's actual constraint, or that another loss is offsetting it.
4,000+ COMPANIES RELY ON ASSET OPERATIONS MANAGEMENT
Leading the Way to a Better Future for Maintenance and Reliability
Your asset and equipment data doesn't belong in a silo. UpKeep makes it simple to see where everything stands, all in one place. That means less guesswork and more time to focus on what matters.






![[Review Badge] Gartner Peer Insights (Dark)](https://www.datocms-assets.com/38028/1673900494-gartner-logo-dark.png?auto=compress&fm=webp&w=336)