Blog Post
Predictive Maintenance Using Big Data: What to Collect First
Predictive maintenance using big data starts with one failure mode. See which records to collect first, how to match them to assets, and what to measure.



Key Takeaways
What it is - Predictive maintenance using big data combines condition readings, repair records, and operating conditions from several systems so analysis can flag a developing fault early enough to plan the repair.
One failure mode first - Starting with one failure mode keeps data collection small enough to finish. Much of what that failure mode needs already sits in the CMMS and the plant’s control system.
Matched records - Matching each reading to the right machine lets the team compare it with past repairs. A simple list pairing each control-system tag with its machine does most of that work.
Recorded causes - Closeouts that record what the technician found keep guesses from passing as confirmed causes. An unknown cause can be updated later, while a wrong guess carries into every report.
Missed failures - Counting missed failures next to alert-to-intervention time shows how many failures the monitoring catches and how fast the team acts. A count of flagged faults alone leaves out failures that came with no alert.
What Is Predictive Maintenance Using Big Data?
Predictive maintenance (PdM) using big data combines condition readings, repair records, and operating conditions from several systems so analysis can flag a developing fault early enough to plan the repair. Calendar-based preventive maintenance (PM) services a machine on a fixed interval, while PdM using big data times the work from the machine’s own readings, repair history, and operating conditions.
A failure that costs a shift of production often shows early signs in data the plant already stores. Take a refrigeration compressor. Its oil temperature trend sits in the control system’s history, its past failures are written up in closed work orders, and the operations team keeps the defrost schedule that changes its load. While those records stay apart, it’s hard to tell whether a rise in oil temperature this week matches what happened before the last failure.
The “big” comes from the mix as much as the size. Readings arrive every few seconds or minutes and pile up fast. They sit beside free-text work order notes and production logs, and a dead sensor or a vague note can quietly mislead. Those traits match big data’s four V’s of velocity, volume, variety, and veracity.
What Are the Benefits of Predictive Maintenance Using Big Data?
The main benefit is an early warning, in time to turn a developing fault into planned work. The repair goes into the next scheduled stop, parts arrive before the technician needs them, and crews handle fewer emergency repairs. Machines with steady readings go longer between services.
Each of those gains depends on accurate records. If a vibration tag points at the wrong blower, or half the failure work orders just say “repaired,” a trend tool flags the wrong machine and past failures can’t explain the trend.
In UpKeep’s 2026 State of Maintenance Report, 70.9% of the 214 maintenance and reliability professionals surveyed rated their data readiness for AI as fair, poor, or undeveloped. Simpler trend alerts draw on the same records AI tools need. Cleaning those records up keeps the first alerts on the right equipment.
What Data Should You Collect First?
Collect the condition reading, repair history, and run conditions that show one failure mode developing on one asset. How detailed that data needs to be depends on the maintenance decision it supports and that decision’s consequences.
Say a snack plant’s reliability lead wants to know whether a bagger’s heated jaws warn early enough to swap a heating element at the next changeover. As an element loses heating capacity, the temperature controller raises its output to hold sealing temperature. The starting set is the bagger’s asset ID, heater current, controller output, seal-cycle counts, past element work orders, and each run’s film type and line speed. Thicker film, faster lines, and a cold room also push output up. Heater current that falls under the same voltage and run conditions is a stronger reason to inspect the element.
The table shows where each record usually lives, such as the computerized maintenance management system (CMMS) or the building management system (BMS), and when to add it.
|
Record |
What to Capture |
Where It Usually Lives |
When to Add It |
|---|---|---|---|
|
Asset IDs and timestamps |
Asset and component ID, each reading’s control-system tag, event times with time zone |
CMMS asset list, control-system tag list |
Start |
|
One condition reading |
Temperature, vibration, current, or pressure difference tied to the failure mode |
Control system, BMS, route readings |
Start |
|
Repair history |
Dates, as-found condition, work done, parts, cause and whether it was confirmed, a reading after the repair |
CMMS work orders |
Start |
|
Operating conditions and usage |
Load, speed, product, cleaning cycles, ambient temperature, run hours, or cycle counts |
Production logs, control system, BMS, meters |
Start, when needed to interpret the reading |
|
More signals and similar machines |
A second measurement, faster sampling, matched machines at other sites |
New sensors, other sites’ records |
Later |
How often a reading is taken depends on how fast the fault develops. An element that weakens over months can be tracked with occasional readings, while a loose electrical connection that heats up within days needs several readings during those days. The review schedule also has to leave time to plan the repair.
Match Each Reading to the Right Machine and Time
A reading can be checked against a work order only when both name the same component and their timestamps are reconciled to a common time reference. The CMMS might list a capper as CAP-04, while the control system logs its motor vibration as CAP04_MTR_VIB. A planner keeps a tag list that pairs each control-system tag with the asset and component it measures.
Plant systems also keep their own clocks and record at different rates. Store times in Coordinated Universal Time (UTC) with the original time zone kept, and mark any stretch when a sensor was offline so a flat line doesn’t pass for a healthy machine. Treat readings after a repair as a new starting point because the repair can change what normal looks like.
Here’s one record that lines up with its work order and one that doesn’t.
|
Field |
Matched Record |
Unmatched Record |
|---|---|---|
|
Tag and asset |
CAP04_MTR_VIB on CAP-04, drive-end motor bearing |
No tag; “Packaging Line 4” |
|
Time |
Reading at 14:10 UTC, inspection at 16:30 UTC |
Work order at 14:45, no time zone |
|
Work order finding |
Drive-end bearing found dry, grease hardened |
“Line stopped,” no machine named |
|
Use in analysis |
Compare readings before the inspection with the finding |
Leave out of the analysis until the machine and time are confirmed |
How Do You Analyze Predictive Maintenance Data?
Start with two simple checks once the records line up. A fixed alert limit trips when a reading crosses a set value, and a trend shows a reading climbing over weeks. Anomaly detection comes next. It compares today’s behavior with the machine’s own normal and flags anything unusual without naming the fault. AI-based models that forecast when a part will fail come last for many teams. They need recorded failures of the same failure mode, a clear definition of failure, and testing on cases the model didn’t learn from.
An alert prevents a breakdown only when someone confirms it and the repair gets done. At the University of Iowa, a controls analytics specialist confirmed a leaking chilled-water valve flagged by building analytics software. A work order went into the CMMS with the fault notes, a technician replaced the valve, and the team checked the trend before closing the fault and the work order.
Read Trends Against Repair History
A trend is easier to read when the closeout records what the technician found. If notes from last spring’s repair say a cracked motor mount was found and vibration dropped back afterward, the reliability lead knows what the rise before that job meant.
Filled-in fields can still be wrong, and missing or inaccurate work order entries skew the metrics calculated from them. Give each failure work order a cause status. It’s confirmed when inspection or parts show the cause, suspected when it’s the technician’s best judgment, and unknown when nobody could tell.
Compare Readings Across Similar Conditions and Machines
Load, speed, product changes, startups, cleaning cycles, and the season all move readings on a healthy machine. Comparing a full-speed run with other full-speed runs keeps a normal swing from looking like wear.
Twelve case erectors across three plants can share a baseline when they match on model, duty, operating environment, sensor position, units and calibration, maintenance plan, and failure definition. The shared baseline makes a drifting unit easier to spot. A well-matched group may still log too few confirmed failures to test a forecast.


How Do You Measure Data Readiness and Results?
Measure data readiness, detection, response, and results separately because a strong number in one can hide a weak one in another. Track them next to the usual predictive maintenance KPIs.
Each measure covers one monitored asset group.
|
Type |
Measure |
How to Calculate |
What It Tells You |
|---|---|---|---|
|
Data readiness |
Reading completeness |
Valid readings received ÷ readings expected on the sensor’s schedule |
Whether analysis has the readings it needs |
|
Data readiness |
Asset match rate |
Records confirmed against the physical component ÷ records sampled |
Whether readings and work orders land on the right equipment |
|
Data readiness |
Cause status recorded |
Failure work orders with a cause status ÷ all failure work orders, “unknown” reported separately |
Whether repairs leave usable history |
|
Data readiness |
Cause verification rate |
Sampled causes supported by parts, photos, and notes ÷ samples reviewed |
Whether recorded causes hold up when checked |
|
Detection |
Missed failures |
Failures of the monitored modes with no related alert beforehand ÷ all failures of those modes since monitoring started, outages included; report how many misses fell during sensor outages |
What share of failures the monitoring didn’t see coming |
|
Detection |
Observed alert-to-failure interval |
Failure time minus the first related alert, where both happened |
How early alerts came on faults that reached failure |
|
Response |
Alert-to-intervention time |
First logged inspection or repair on the fault minus the time of the confirmed alert |
How quickly the team acts on a confirmed alert |
|
Results |
Unplanned downtime rate |
Unplanned maintenance downtime hours ÷ operating hours |
Whether results changed, compared across periods with similar output |
The observed interval counts only faults that ran to failure. A repair made in time leaves just the alert-to-intervention time. Because alerts tend to trail a fault’s first detectable sign, the measured warning runs shorter than the machine’s actual warning. Report the interval next to the missed-failure count because a program that prevents most failures leaves few intervals to measure. With only a handful of events, report counts and skip percentages.
How Do You Start With the Data You Already Have?
Start with one failure mode, audit the records you already keep, and line them up by asset and time before adding sensors.
Choose One Failure Mode: The maintenance manager and reliability lead pick one asset group and one costly failure mode that gives warning. Fouling in a plate heat exchanger works well because pressure drop and outlet temperature drift over weeks. They agree on what counts as failure and write down the decision the data supports, such as cleaning the exchanger at the next shutdown.
Audit What You Already Record: In the first two weeks, the planner and a lead technician list every record for that failure mode, including work orders, inspection routes, control-system points, meter readings, and lab results. Each record on the list gets a source and a recording frequency, or a note that it’s missing.
Line Up Assets and Clocks: The planner and the IT or controls team build the tag list, set one time standard, and confirm units. A CMMS data quality audit clears out duplicate assets and blank fields. The step is done when a spot check finds every sampled record on the right component. A first sample might be about 20 readings and 10 work orders.
Record What Technicians Find: The reliability lead sets up a short list of failure codes for that failure mode’s likely causes. Technicians enter the as-found condition, work done, failure code, and cause status before leaving the machine. Each month, the reliability lead checks a few closed work orders against parts and photos. Food manufacturer Water Lilies used its UpKeep work order history to trace repeated dough-sheeter bearing failures to flour contamination, and a $12 cap on the bearings addressed that cause.
Add Sensors Only Where the Audit Shows a Gap: If no existing reading tracks the failure mode often enough, the reliability lead specifies one new sensor and where to mount it. The maintenance manager names an owner for every alert so a confirmed finding moves straight to a work order. The step is done when the reading appears on the right asset record and its tag is on the tag list.
Attach Operating Conditions to the Readings: Operations shares the production, cleaning, and shift logs for conditions that move the reading, and the planner adds them to the asset’s history. Each reading then carries its run condition.
Review Each Quarter, Then Expand: The reliability lead reviews the measures above each quarter, plus any case where a trend and an inspection disagreed. Once spot checks keep coming back clean, the team moves to the next failure mode.
From Scattered Records to Planned Maintenance
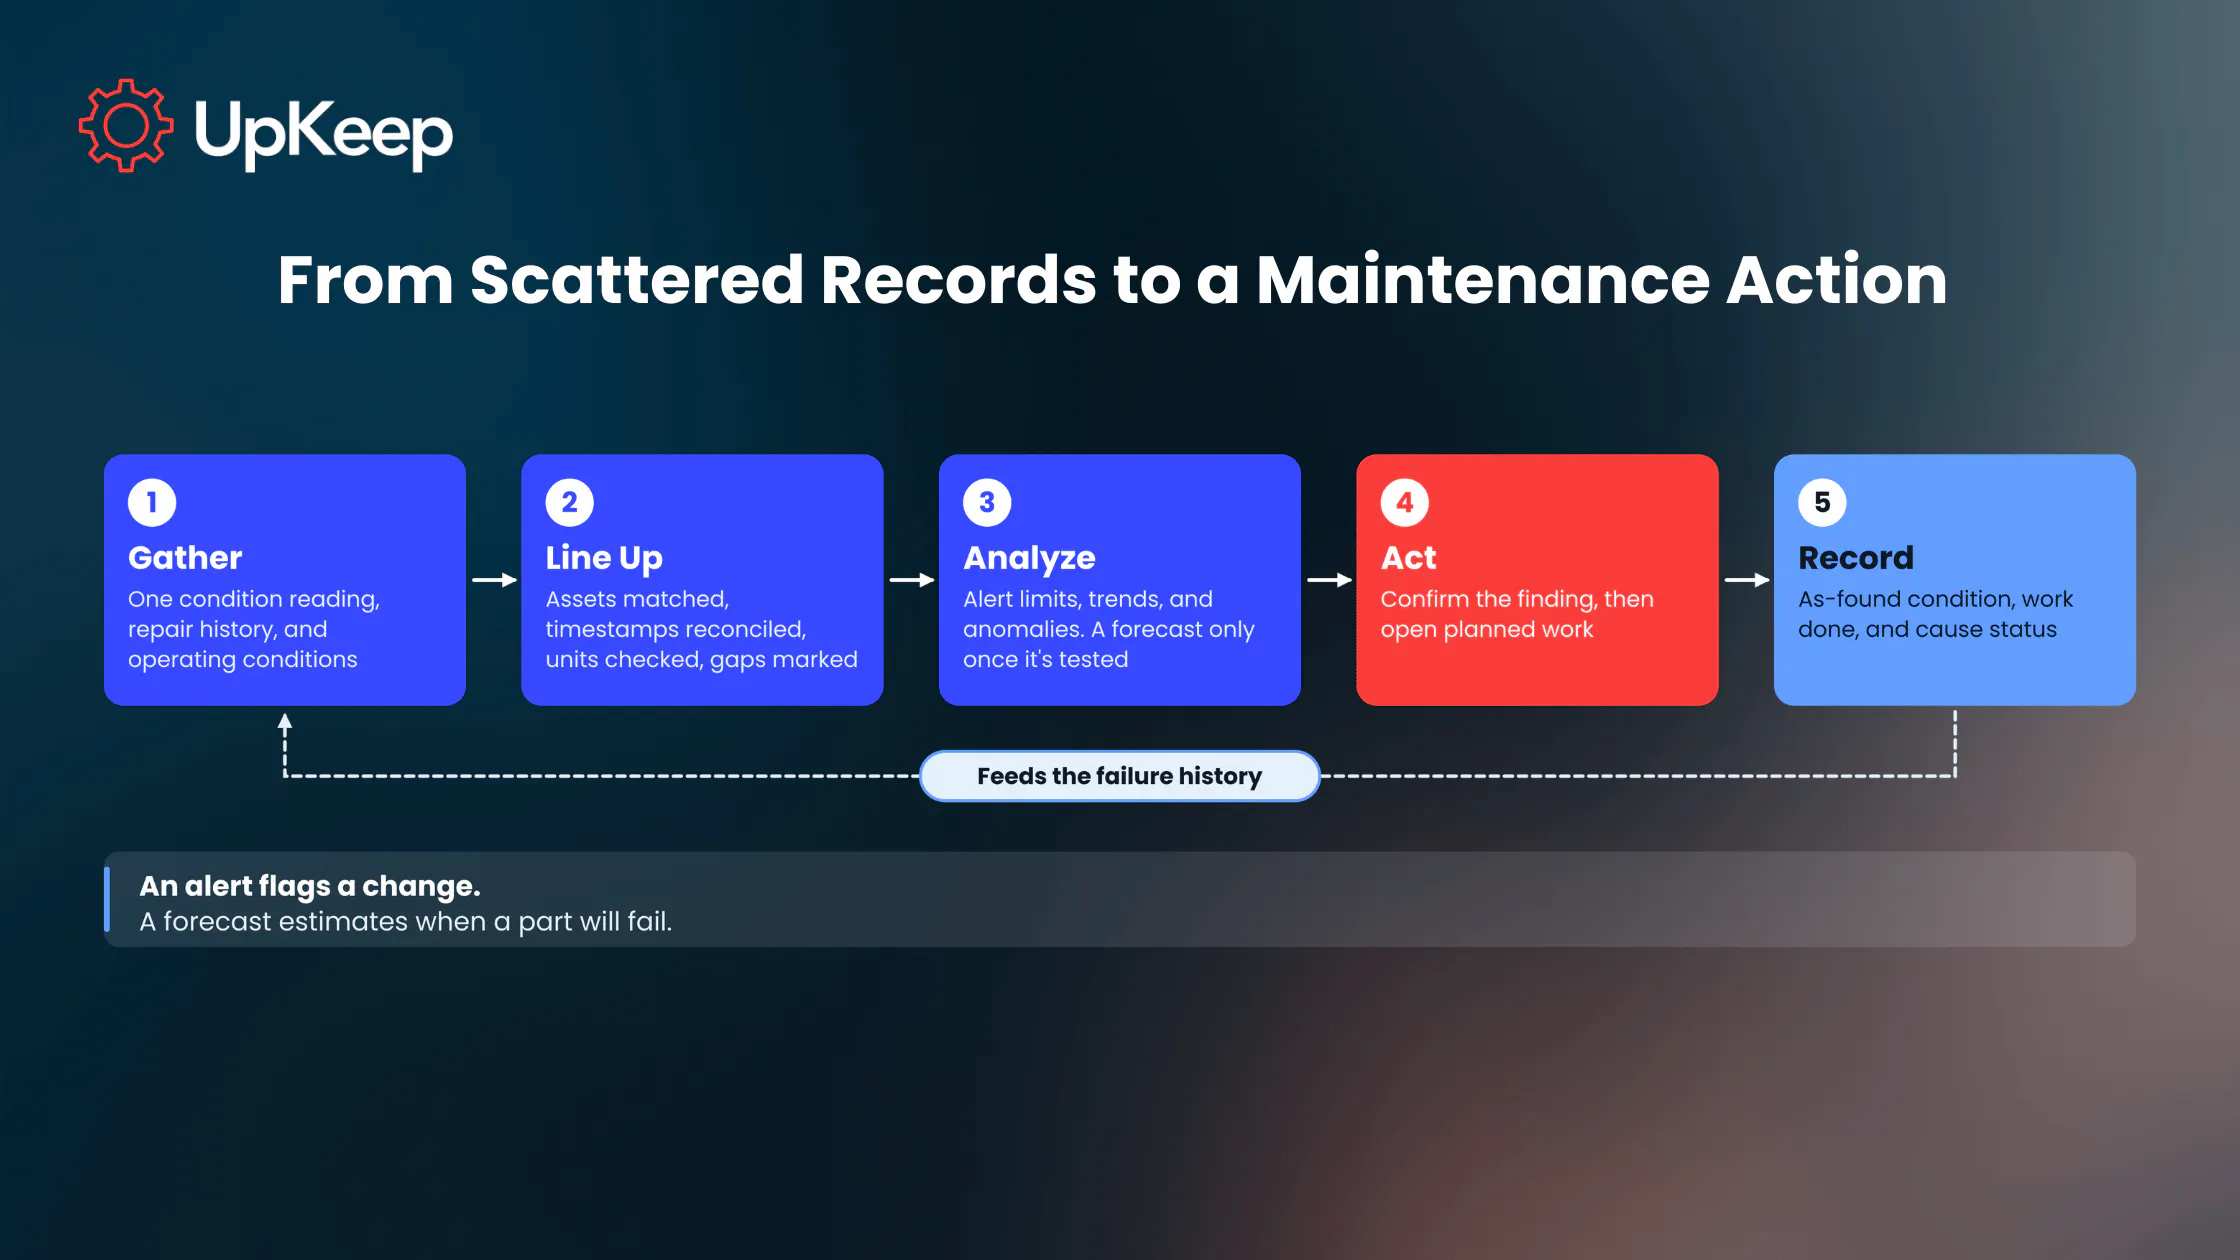
When condition readings and repair notes sit in separate systems, a recurring fault can show up first as downtime.
Once one asset group’s records line up, a rising reading points to the right machine, and its repair history shows what the rise meant last time. Unplanned downtime on those assets can then be compared by quarter.
In UpKeep, each condition-monitoring Edge sensor is linked to its asset, and its readings sit next to the asset’s work order history. When a reading meets the alert conditions configured for that sensor, an incident opens. A work order can be opened from the alert with the sensor details attached, and the technician closes it on a phone with the as-found condition and cause. A planner can ask Nova, UpKeep’s AI assistant, why the same fault keeps recurring on that asset, and Nova pulls up the asset’s work orders and sensor history. Any action Nova suggests waits for a person to approve it.
Take an UpKeep product tour to see how your team can plan repairs from the data it already keeps.
Frequently Asked Questions
What is an example of predictive maintenance using big data?
An example of predictive maintenance using big data is a transit agency comparing motor current across its escalator drives. When one drive draws more current than the others under similar loads, the team checks that drive’s work orders for what technicians found the last time that happened. If a technician confirms a stretched drive chain, the repair is scheduled overnight.
How much data do you need for predictive maintenance?
The data you need for predictive maintenance grows with the analysis. A trend alert needs one condition reading, repair history, and run conditions for one failure mode, plus enough normal readings to cover startups, product changes, and seasons. A failure forecast also needs several recorded failures of that mode, with clear dates and causes.
Do you need a data scientist to use big data for predictive maintenance?
You don’t need a data scientist to start using big data for predictive maintenance. A reliability team can set up the alert limits, trends, and anomaly alerts in maintenance software. Custom failure-forecasting models usually need one. Either way, the maintenance team supplies the records behind the analysis, each tied to the right component, with the cause recorded.
What’s the difference between big data and predictive analytics in maintenance?
Big data in maintenance is the combined record: readings, work orders, and operating logs from several systems. Predictive analytics is the set of methods run on that record, from trend checks to failure forecasts. A plant can hold plenty of data and get little useful analysis when the records don’t line up by machine and time.
Can you use big data for predictive maintenance without new sensors?
Yes, you can start predictive maintenance using big data without new sensors when the plant already records a relevant reading. Control-system tags, BMS points, route readings, and oil analysis results can all track how a failure mode develops. Work order history and meter readings alone support failure-rate analysis and usage-based PM, which stays preventive because nothing reads the machine’s condition.
4,000+ COMPANIES RELY ON ASSET OPERATIONS MANAGEMENT
Leading the Way to a Better Future for Maintenance and Reliability
Your asset and equipment data doesn't belong in a silo. UpKeep makes it simple to see where everything stands, all in one place. That means less guesswork and more time to focus on what matters.