Blog Post
Predictive Maintenance KPIs: 5 Metrics Every Team Should Track for Reliability
Are you running the right numbers for your equipment servicing? Check out these predictive maintenance KPIs to ensure your program is functioning.


Key Takeaways
Predictive maintenance only delivers value if your program reduces failures, accelerates repairs, and justifies its investment.
The KPIs that matter most are OEE, MTBF, MTTR, PMP, and ROI, maintenance cost as a percentage of RAV, and avoided downtime cost.
Planned maintenance percentage (PMP) directly tracks organizational maturity. Best-in-class programs maintain a PMP of 85% or higher, which reduces overtime, lowers emergency parts costs, and improves technician productivity.
Predictive maintenance programs can reduce downtime by up to 50%, cut maintenance costs by 25%–30%, and return up to 10 times the initial investment.
Predictive maintenance (PdM) promises to fix problems before they become failures. By combining asset condition data, IoT sensors, AI analytics, and maintenance workflows, organizations can reduce downtime, improve reliability, and extend equipment life.
But deploying PdM technology is only half the equation.
Without the right predictive maintenance KPIs, it's impossible to know whether your program is actually delivering value. Are failures becoming less frequent? Are repairs happening faster? Is maintenance becoming more proactive instead of reactive? These are the questions that PdM KPIs answer.
Organizations that successfully measure predictive maintenance performance gain more than operational visibility. They create a shared understanding between maintenance, operations, and leadership teams around reliability goals, cost reduction initiatives, and asset performance outcomes.
In this guide, we'll explain what predictive maintenance KPIs are, how they differ from maintenance metrics, and the most important KPIs to track for long-term program success.
What Is a Maintenance KPI?
Unlike general maintenance data, KPIs connect day-to-day maintenance activity to larger outcomes, such as:
Asset reliability
Equipment uptime
Maintenance cost control
Productivity improvements
Risk reduction
Operational efficiency
Effective maintenance KPIs are specific, measurable, and tied directly to organizational goals that matter to both frontline teams and executive leadership. They help maintenance managers move beyond intuition and make decisions based on objective performance data.
When tracked consistently, maintenance KPIs become a single source of truth for asset performance, helping organizations prioritize investments, identify reliability risks, and continuously improve maintenance operations.
The Difference Between Maintenance KPIs and Performance Metrics
The terms "metric" and "KPI" are often used interchangeably, but they actually serve different purposes:
A maintenance metric measures activity, such as number of completed work orders, total maintenance hours, and spare parts used.
Maintenance KPIs measure progress toward a specific outcome. A KPI can be a metric, but a metric isn’t necessarily a KPI.
The distinction is important because not every metric drives meaningful business decisions. Completing 500 work orders sounds impressive, but if most of those work orders were emergency repairs, reliability may actually be declining.
Predictive maintenance programs are especially vulnerable to this mistake. Teams can become focused on collecting data and generating alerts while missing the bigger picture of: Is asset performance improving?


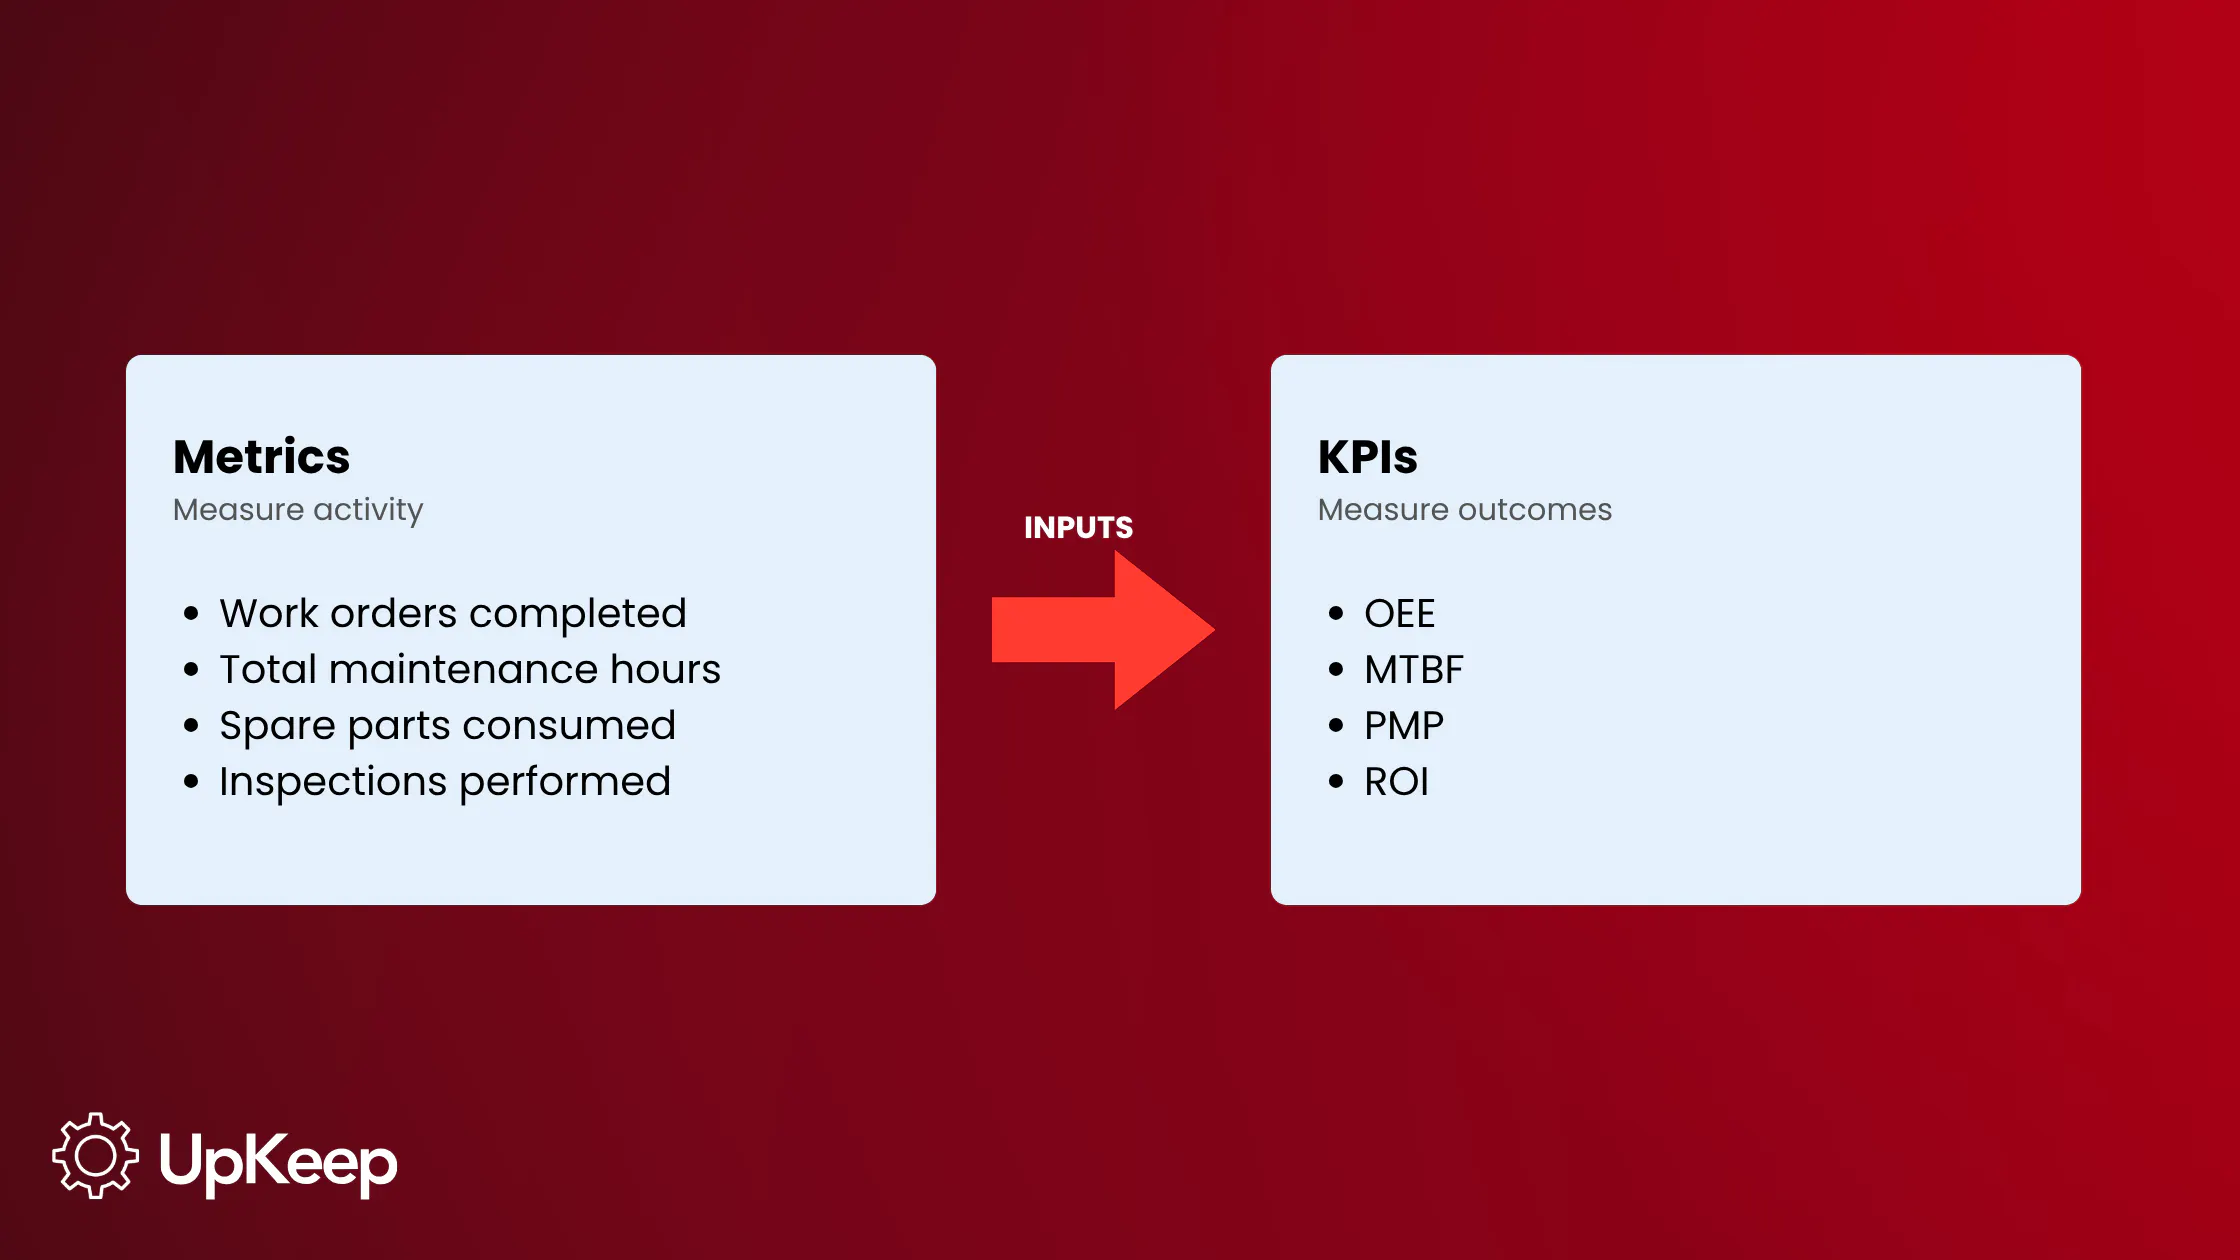
High-performing organizations use metrics as inputs and KPIs as outcomes. Together, they create a feedback loop that drives continuous improvement and demonstrates measurable business value.
What Predictive Maintenance KPIs Should You Track?
While every organization has unique goals, several PdM KPIs consistently provide the clearest picture of program health and performance. Here are seven core metrics to get you started.
1. Overall Equipment Effectiveness (OEE)
Overall equipment effectiveness (OEE) measures how effectively equipment is utilized during planned production time. It combines availability, performance, and quality:
OEE = Availability × Performance × Quality
Industry experts generally consider an OEE score of 85% or higher to be excellent, but average performance across industries is closer to 60%.
For PdM teams, OEE serves as an early warning system. Declining availability scores often signal developing equipment issues long before a major failure occurs. By monitoring OEE trends alongside condition monitoring data, maintenance teams can identify assets that require intervention before downtime impacts production.
Over time, improving OEE demonstrates a predictive maintenance program is successfully preventing failures and improving asset reliability.
2. Mean Time Between Failures (MTBF)
Mean time between failures (MTBF) measures the average operating time between equipment failures. The formula is:
MTBF = Total Uptime / Number of Failures
MTBF is one of the most important predictive maintenance KPIs because it directly measures reliability. As PdM programs mature, MTBF should increase. Longer intervals between failures indicate that condition monitoring, predictive analytics, and proactive interventions are successfully preventing breakdowns before they occur.
MTBF data also helps maintenance leaders make smarter investment decisions. Assets with declining MTBF trends may require additional sensors, enhanced monitoring, or revised maintenance strategies.
3. Mean Time to Repair (MTTR)
While MTBF measures reliability, mean time to repair (MTTR) measures maintenance responsiveness, tracking the average time required to restore an asset after a failure occurs.
MTTR = Total Repair Time / Number of Repairs
Total repair time includes:
Failure identification
Troubleshooting
Parts acquisition
Repair execution
Asset restart
Even the most mature PdM program can’t eliminate every failure. When it happens, minimizing downtime becomes critical. Lower MTTR often indicates better technician preparedness, faster troubleshooting, improved parts availability, and more effective maintenance workflows.
Early failure warnings give maintenance teams a head start on parts procurement and labor scheduling, which directly compresses MTTR even when failures do occur. In turn, an optimized MTTR can reduce total maintenance costs.
Mobile-first maintenance platforms like UpKeep further accelerate repairs by providing instant access to asset history, documentation, and work order information directly from the field.
4. Planned Maintenance Percentage (PMP)
Planned maintenance percentage (PMP) measures how much maintenance work is scheduled versus reactive.
PMP = (Scheduled Maintenance Hours / Total Maintenance Hours) × 100
PMP is particularly valuable because it reflects organizational maturity. Industry recommendations suggest a PMP benchmark of 85% or higher. A low PMP indicates maintenance teams are still spending significant time responding to emergencies and unplanned breakdowns. Meanwhile, a high PMP demonstrates a successful transition toward proactive maintenance.
As predictive maintenance programs mature, PMP should steadily increase. Rising PMP scores typically lead to benefits such as:
Reduced overtime expenses
Lower emergency parts costs
Improved technician productivity
Better safety outcomes
Increased schedule compliance
5. Return on Investment (ROI)
Every predictive maintenance initiative must ultimately show financial value. ROI quantifies the relationship between program costs and realized benefits.
ROI = Net Return / Cost of Investment
Launching a predictive maintenance program requires a large investment in sensors and monitoring equipment, software subscriptions, training and onboarding, and internal labor.
ROI calculations should include both hard savings, like avoided repair costs or reduced parts spend, and soft savings, such as fewer safety incidents, lower technician overtime, and improved compliance.
For example, users see an average 652% ROI when integrating UpKeep analytics into workflows. Operational analytics that track cost-per-work-order and maintenance spend help leaders justify future investments.
6. Maintenance Cost as a Percentage of Replacement Asset Value (RAV)
Maintenance cost as a percentage of RAV measures total annual maintenance spend relative to the estimated cost of replacing your asset base.
Maintenance Cost % of RAV = (Total Annual Maintenance Cost / Total Replacement Asset Value) × 100
Industry benchmarks suggest that well-run maintenance programs typically spend between 2%–3% of RAV annually. Spending below 2% may indicate that assets aren't receiving adequate attention, and failure risk is quietly accumulating. Spending above 4% often signals excessive reactive maintenance, aging equipment, or inefficient workflows that are eroding budget without delivering reliability gains.
As PdM matures and unplanned failures decrease, maintenance cost as a percentage of RAV should trend downward to indicate more planned, lower-cost interventions. Tracking this metric can also strengthen the business case for continued PdM investment.
7. Avoided Downtime Cost
Avoided downtime cost estimates the financial impact of failures that PdM prevented, translating early detection into a dollar figure that finance and operations leadership can understand at a glance.
Avoided Downtime Cost = (Historical Failure Frequency × Average Cost per Failure Event) − Actual Downtime Cost
Average cost per failure event should account for lost production, expedited parts and labor, overtime, and any associated safety or compliance exposure, not just the repair invoice itself. While MTBF and PMP demonstrate operational maturity, avoided downtime cost translates that maturity directly into avoided spend, making it a useful figure for budget conversations and renewal justifications.
In an ongoing PdM program, avoided downtime cost should trend upward even as actual downtime cost trends downward. Tracking both figures side by side helps confirm the gain is coming from genuine prevention.
Seven Core PdM KPIs
|
PdM KPI |
Definition |
Calculation |
|
Overall equipment effectiveness (OEE) |
How effectively equipment performs during planned productive time |
OEE = Availability x Performance x Quality |
|
Mean time between failures (MTBF) |
The average operating time between equipment failures |
MTBF = Total Uptime x Number of Failures |
|
Mean time to repair (MTTR) |
The average time taken to restore an asset after failure |
MTTR = Total Repair Time / Number of Repairs |
|
Planned maintenance percentage (PMP) |
The amount of maintenance work that’s scheduled vs. reactive |
PMP = (Scheduled Maintenance Hours / Total Maintenance Hours) × 100 |
|
Return on investment (ROI) |
The relationship between program costs and its benefits |
ROI = Net Return / Cost of Investment |
|
Maintenance cost as a percentage of replacement asset value (RAV) |
The total annual maintenance spend relative to the estimated cost of replacing your asset base |
Maintenance Cost % of RAV = (Total Annual Maintenance Cost / Total Replacement Asset Value) × 100 |
|
Avoided downtime cost |
Estimates the financial impact of failures that PdM prevented |
Avoided Downtime Cost = (Historical Failure Frequency × Average Cost per Failure Event) − Actual Downtime Cost |
Best Practices for Implementing Predictive Maintenance KPIs
Start with a small number of high-impact KPIs
Avoid tracking dozens of metrics immediately. Monitoring too many too soon can distract from the actionable insights the data provides. Focus on a core set of predictive maintenance KPIs such as the ones outlined above.
Once those metrics integrate into daily operations, expand your reporting framework.
Measure baseline performance
Use the information from initial KPI readings to gauge your team’s current performance before launching a PdM initiative. Without that baseline data, it's difficult to determine whether improvements are the result of predictive maintenance or external operational changes.
Make KPI data visible
KPIs should be visible to both technicians and leadership. Technicians need work order-level feedback, while operations leaders need asset- and site-level trend data. Role-based dashboards help every stakeholder access relevant information without being overwhelmed by unnecessary data. UpKeep's role-based dashboards are built with this in mind, automatically bringing the right data to the right person.
Review KPI targets regularly
Data aggregates as PdM programs mature, which can inform and evolve performance expectations. Reviews on a quarterly, monthly, or weekly basis (based on the KPI) help organizations refine targets, identify emerging opportunities, and ensure KPI goals align with business priorities.
Connect KPIs to team success
Connect KPI performance to maintenance team incentives and recognition to treat reliability as a shared organizational priority.
Team culture and trust are important for any new process. Ensure your employees understand KPIs are improvement tools, not performance surveillance. When they see how these numbers translate to reduced emergency work, improved safety, and more predictable schedules, they’ll be more comfortable with relying on them.
Challenges in Managing Your Predictive Maintenance KPIs
Many organizations struggle to manage PdM KPIs effectively due to common challenges like:
Poor data quality: Incomplete work orders, missing sensor data, and inconsistent asset records create unreliable data that can undermine KPI accuracy.
Disconnected systems: When maintenance, operations, safety, and asset data exist in separate systems, calculating company-wide PdM KPIs becomes difficult and time-consuming. A connected asset operations platform eliminates data silos by creating a unified view of maintenance performance.
Resistance to KPI tracking: Technicians may view KPI monitoring as a performance evaluation tool rather than a support. Emphasizing positive team outcomes like reduced emergency work and improved safety encourages stronger adoption.
Lack of standardization: Different facilities often calculate KPIs differently. Without standardized workflows and reporting methodologies, benchmarking across locations is unreliable.
Using AI and Analytics for Predictive Maintenance KPIs
AI is rapidly transforming how organizations monitor and improve PdM KPIs. Predictive analytics tools can identify anomalies in asset condition data and correlate them with historical failure patterns, providing the underlying signal that predictive accuracy KPIs measure.
Meanwhile, customizable dashboards built around site-specific KPIs allow reliability engineers, operations managers, and executives to monitor the metrics most relevant to their role without wading through a mountain of unnecessary data.
As AI models train on more operational data over time, predictive accuracy scores improve, allowing for a shift in preventive maintenance (PM) schedules so that resources can go toward assets that need them most.
Instead of relying on spreadsheets and manual reporting, maintenance teams gain immediate visibility into reliability trends and performance outcomes. This enables organizations to move beyond reactivity and toward continuous optimization.
Turn Predictive Maintenance Data Into Action
Tracking predictive maintenance KPIs is essential for proving program value and driving continuous improvement. Metrics like OEE, MTBF, MTTR, PMP, predictive accuracy, and ROI provide a comprehensive view of asset reliability, maintenance efficiency, and business impact.
With the right KPIs in place, your maintenance program offers a strategic advantage that improves uptime, reduces risk, and helps your teams make smarter decisions about assets, operations, and future investments.
Platforms like UpKeep combine connected asset data, maintenance workflows, IoT monitoring, and operational analytics in a single environment. Reliability engineers and operations leaders can track predictive maintenance KPIs through customizable dashboards, creating a shared source of truth that supports faster decisions and more effective maintenance strategies.
Learn how UpKeep can unify your PdM KPI data. Try it free today.
Frequently Asked Questions About PdM KPIs
What is the difference between MTBF and MTTR?
MTBF measures reliability (how long equipment runs before breaking down). MTTR measures responsiveness (how quickly a team restores equipment after a failure). A strong predictive maintenance program improves both, yielding longer intervals between failures and shorter recovery times when they do occur.
What is a good OEE score for manufacturing?
An OEE score of 85% or higher is considered excellent. However, the average across industries is closer to 60%. For predictive maintenance teams, OEE is most useful as a trend indicator, since a declining score often means there’s a developing equipment issue.
What ROI can organizations expect from predictive maintenance?
Strong predictive maintenance programs can produce 10 times the initial investment under optimal conditions. Deloitte research suggests PdM can reduce downtime by up to 50% and cut maintenance costs by 25%–30%.
What is the difference between a maintenance metric and a maintenance KPI?
A maintenance metric measures activity, such as work orders completed, hours logged, parts used. A KPI measures progress toward a strategic outcome, like improved reliability or lower costs. A KPI is a metric, but not every metric is a KPI.
How do you measure the success of a predictive maintenance program?
The clearest indicators are rising MTBF (fewer failures), falling MTTR (faster repairs), increasing PMP (more planned versus reactive work), improving OEE (better equipment utilization), and ROI. Together, these KPIs show whether a program is delivering operational and financial value.
4,000+ COMPANIES RELY ON ASSET OPERATIONS MANAGEMENT
Leading the Way to a Better Future for Maintenance and Reliability
Your asset and equipment data doesn't belong in a silo. UpKeep makes it simple to see where everything stands, all in one place. That means less guesswork and more time to focus on what matters.