Blog Post
Key Strategies to Reduce Equipment Downtime Before It Costs You
Discover proven strategies to reduce equipment downtime. Learn the hidden costs of unplanned stops, common root causes, and how to boost OEE in your plant.



Key Takeaways
Unplanned downtime multiplies costs exponentially because hidden expenses are two to three times higher than the direct repair bill itself.
Sudden equipment failures stem from compounding systemic gaps, including deferred reactive maintenance, aging machinery, human operator error, and isolated data silos.
To prove that downtime reduction strategies are working, plants must link maintenance to output using core KPIs like overall equipment effectiveness (OEE), mean time between failures (MTBF), and mean time to repair (MTTR).
Reducing downtime requires a deliberate shift from reactive to proactive operations by implementing preventive and predictive maintenance, optimizing spare parts, prioritizing assets by criticality, and centralizing data in a modern CMMS.
Long-term reliability can only last when maintenance is treated as a strategic driver of production rather than a cost center. That requires cross-functional alignment, rigorous operator training, and a root cause analysis (RCA) after major failures.
Unplanned equipment downtime is one of the most expensive and pervasive problems on any production floor, and most manufacturing plants are losing far more to it than they realize. Across U.S. manufacturers alone, unplanned downtime can cost up to $600 a second.
For maintenance managers, plant supervisors, and operations leaders, learning how to reduce equipment downtime is a strategic necessity that directly impacts profit margins and market competitiveness.
This article walks through what separates planned from unplanned downtime, why unplanned stops hurt your revenue, the hidden root causes behind most catastrophic failures, and actionable strategies to reduce unplanned equipment downtime. You’ll also learn how leveraging a modern CMMS (computerized maintenance management system) can improve your maintenance workflow, as well as the specific KPIs you need to track to prove your strategies are working.
Planned vs. Unplanned Downtime
Downtime can be separated into two types: planned and unplanned.
Planned downtime covers scheduled maintenance, changeovers, equipment upgrades, and facility improvements. Because it's known in advance, it can be scheduled around production demand and budgeted for.
Unplanned downtime is the opposite. A machine fails, a part doesn't arrive in time, an operator makes an error, or a process simply breaks down without warning. The line stops, and nobody saw it coming.
|
Characteristic |
Planned Downtime |
Unplanned Downtime |
|
Predictability |
High (Scheduled in advance) |
Zero (Sudden failure) |
|
Cost Impact |
Budgeted, controlled costs |
Exponentially high (Expedited parts, overtime) |
|
Production Impact |
Minimal (Aligned with low demand) |
Severe (Line stoppage, missed deliveries) |
Why Unplanned Downtime Is More Expensive and Damaging
Unplanned stops cost more than planned downtime mainly because they trigger emergency repairs, overtime labor, rush-shipped parts, and cascading schedule disruptions that planned maintenance windows avoid.
The dollar figures are staggering. Recent industry research found that Fortune Global 500 companies collectively lose about $1.4 trillion a year to unplanned downtime, roughly 11% of their total revenue.
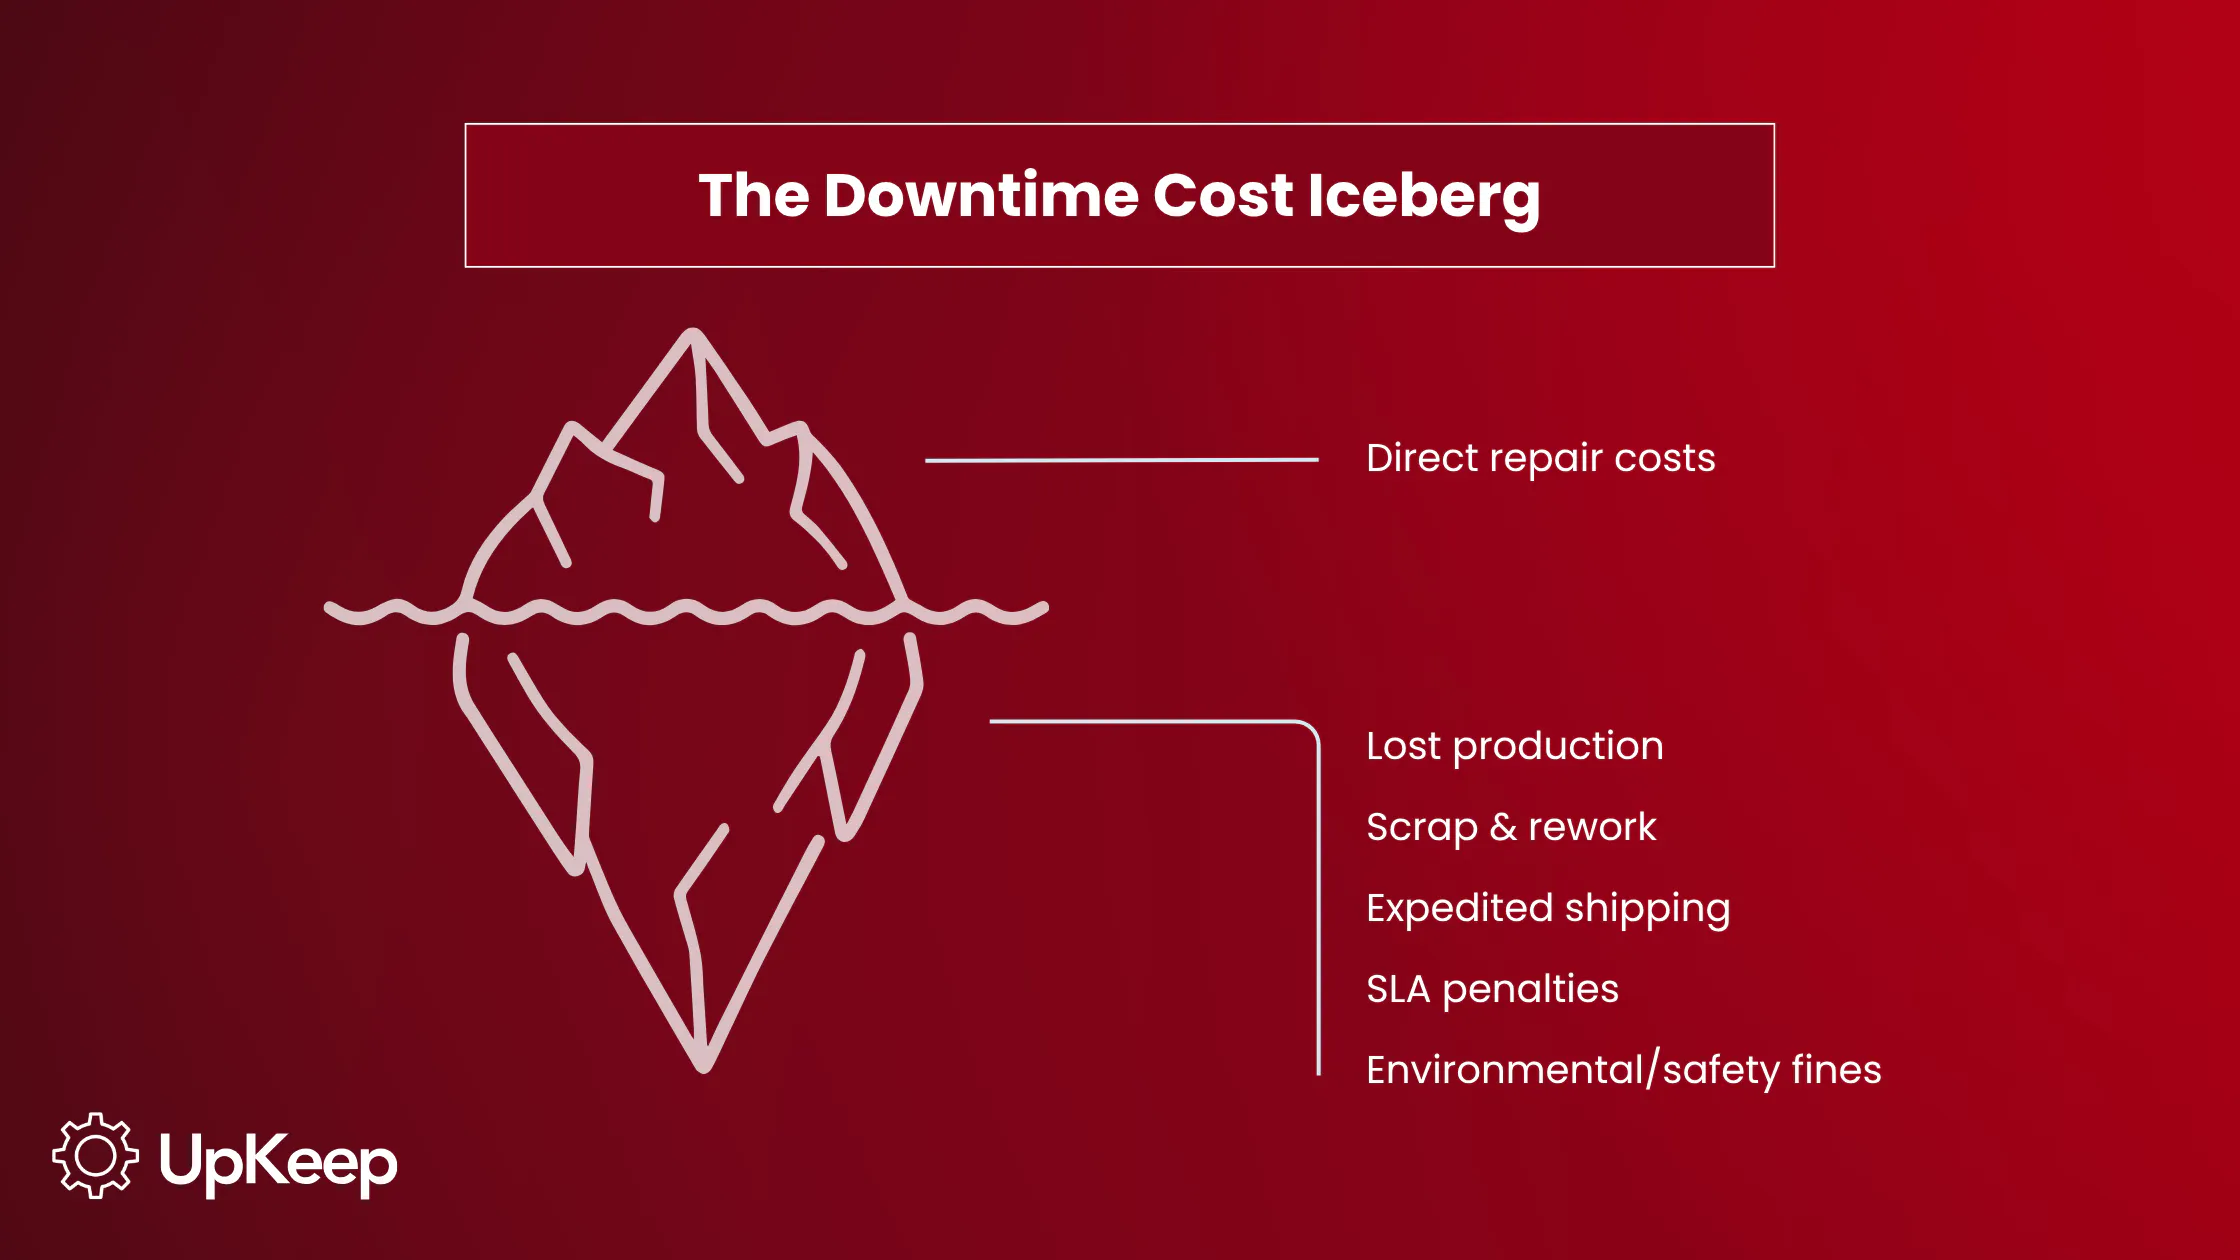
The Downtime Cost Iceberg
Beyond lost output and repairs are hidden costs. Industry analyses suggest they typically run two to three times higher than the direct repair bill alone. These expenses include:
Idle Labor: Operators and downstream workers still draw full wages while waiting for a fix
Scrap and Rework: Materials ruined during a sudden stop or a hard restart
Expedited Shipping: Emergency parts marked up 30%–40% over planned pricing
Penalties and SLA Breaches: Contractual fines for missed shipments or damaged client trust
Environmental/Safety Fines: Potential hazards created by sudden mechanical failures


OEE: The Standard Metric Linking Downtime to Performance
Overall equipment effectiveness (OEE) is the industry-standard metric that connects downtime to plant-wide performance. It's calculated by multiplying three variables:
Availability (the percentage of scheduled time the equipment is actually running)
Performance (how close to ideal speed it runs while available)
Quality (the percentage of output that meets spec without rework)
The formula works out to: OEE = Availability × Performance × Quality
A stellar OEE score is 85% or higher, but very few plants reach this. Industry data puts the typical manufacturing average at 55%–65%, and only about 6% of manufacturing organizations consistently hit the 85% or higher threshold.
Even strong individual numbers can produce a mediocre overall score though; a plant running 90% availability, 90% performance, and 90% quality still nets only a 73% OEE. Downtime is almost always the biggest lever for moving that number, since unplanned stops directly impact the availability factor.
The Root Causes of Unplanned Equipment Downtime
Most plants don't lose production time due to a single, dramatic failure. It's usually a mix of overlapping, preventable issues. Equipment failure alone is estimated to account for roughly 42% of unplanned downtime industry-wide, with human error responsible for another 23%.
The other sources are typically:
Deferred or inadequate preventive maintenance, including running assets to failure. Skipped or delayed PM tasks let small issues like worn bearings or slipping belts progress into full breakdowns. Despite the clear cost of this approach, many manufacturers still rely primarily on reactive maintenance.
Aging equipment and component wear. Many maintenance professionals cite aging machinery as a leading contributor to unplanned stops, and a notable share of plants haven't modernized motor-driven systems in years, leaving preventable failures on the table.
Operator error and misuse, including inadequate training or unclear standard operating procedures (SOPs). Improper startup sequences, incorrect settings, and missed warning signs all fall into this category, and it's a larger driver of downtime than most plant managers realize.
Poor spare parts inventory management or extended repair time due to missing parts. When the right part isn't on the shelf, a routine repair turns into a multi-day outage while parts are sourced and expedited at a premium.
Lack of real-time equipment visibility. Without sensors or condition monitoring, the first sign of a developing problem is often the failure itself, rather than a warning days or weeks in advance.
Data silos between maintenance and operations teams. When maintenance history, production schedules, and asset condition data live in separate systems, nobody has the full picture needed to anticipate or prioritize repairs.
External factors such as weather, jobsite hazards, and power quality issues can cause unexpected stops even on well-maintained equipment.
7 Tested Strategies to Reduce Equipment Downtime
Chasing a single fix won’t cut down on equipment downtime. It requires a layered approach that moves a plant from reacting to failures toward anticipating and preventing them. The following strategies present an effective roadmap to achieve this.
1. Shift From Reactive to Preventive Maintenance
First and foremost, abandon the run-to-failure model. Replace it with a robust preventive maintenance program that includes time- or usage-based inspections, lubrication, part replacements, and calibrations. A mature PM program is the bedrock on which all other reliability efforts are built.
2. Implement Predictive Maintenance (PdM) Technologies
While preventive maintenance follows a fixed schedule, predictive maintenance uses condition data, vibration, temperature, and oil analyses, and IIoT sensors to flag developing problems before they cause downtime. The results are well documented, with a widely cited NIST study revealing how manufacturers that use predictive maintenance see a 15% decrease in downtime, an 87% lower defect rate, and 66% fewer spikes in inventory attributed to unscheduled maintenance.
3. Optimize Spare Parts and Inventory Management
A repair that should take an hour can stretch into days if the right part isn't on hand. Building a criticality-based spare parts strategy shortens mean time to repair (MTTR) and removes a common multiplier of unplanned downtime. This strategy categorizes inventory based on failure probability and outage costs. Insurance spares are stocked for high-risk, single-point-of-failure components where the cost of an outage easily justifies the carrying expense, while fast-moving consumables like belts and filters require strict minimum and maximum levels to support daily operations. Other low-risk items with minimal production impact and fast vendor delivery times can safely be ordered on demand to prevent inventory bloat.
Integrate your spare parts data into a CMMS so maintenance teams can automatically trigger purchase orders when stock drops below predefined thresholds. For this automated reordering to be accurate and prevent stockouts and overstocking, the system relies on precise data inputs to calculate the exact reorder point. The CMMS must specifically track the vendor lead time (how long it takes to process and deliver), the historical usage rate of the component, and the equipment criticality, which dictates whether expedited shipping is necessary to protect your bottom line.
4. Adopt a Reliable CMMS
A CMMS is the nervous system of a reliable plant. It centralizes work orders, asset history, manuals, and failure codes. Through a CMMS, techs can pull up SOPs, log work orders, and check off service events directly from the shop floor. This eliminates data silos and gives leadership the analytics needed to make strategic capital decisions.
5. Standardize Operator Training and Equipment SOPs
Human error is responsible for a significant portion of unplanned downtime, but daily equipment operators are also able to detect warning signs of failure like unusual sounds, vibration changes, or temperature spikes. Clear, consistently enforced SOPs and structured operator training close a gap that technology alone can't fix. This entails proper startup and shutdown sequences, defined escalation paths for abnormal readings, and refresher training tied to actual incident data rather than a generic annual checklist.
6. Apply Asset Criticality Rankings to Prioritize Resources
Not every asset deserves the same level of attention. For instance, a production line's main drive motor is a Tier 1 asset that stops operations if it fails, demanding immediate action. On the other hand, an auxiliary storage room exhaust fan would be deemed a Tier 3 asset with zero production impact that can safely be allowed to run to failure.
Prioritizing assets in this way ensures your maintenance budget and labor are fiercely protected for the equipment that actually drives your bottom line. Calculate how much a failure would cost in lost production, safety risk, and repair complexity for each piece of equipment to rank their priority. This helps maintenance teams direct limited labor and budget toward the machines that matter most, rather than spreading resources evenly across the whole floor.
7. Conduct Rigorous Root Cause Analyses (RCA)
When a breakdown does occur, fixing the broken part is only half the job. To slash equipment downtime over the long term, you have to understand why it broke in the first place. Introduce root cause analysis frameworks such as the 5 Whys or Fishbone diagrams after every major downtime event to identify the root cause and permanently engineer it out of your process.
The 5 Whys framework is efficient for resolving isolated, single-point failures because of its straightforward cause-and-effect structure. Conversely, Fishbone or Ishikawa diagrams excel at troubleshooting complex, multi-system failures where many operational variables cause the disruption. Documenting findings prevents future failures and boosts an asset’s usability.
Building a Culture That Sustains Reduced Downtime
Tools and schedules only go so far without the organizational habits to back them up. Plants that sustain low downtime over the long term tend to share certain workplace traits and mindsets:
Maintenance is seen as a strategic function. When maintenance is funded and staffed as a driver of output rather than a line item to minimize, PM compliance and equipment reliability both improve.
Cross-functional alignment between maintenance, operations, and procurement. Downtime reduction breaks down when these groups have competing goals, like operations pushing for maximum uptime today while maintenance needs a window to do the work that prevents tomorrow's failures.
A good CMMS bridges the communication gap between operations and maintenance by replacing departmental silos with a single, objective source of truth. Features such as shared visual calendars and data-driven risk quantification allow plants to align both teams around transparent scheduling and shared productivity goals.
Maintenance KPIs tied directly to production KPIs in leadership reporting. When OEE, MTBF, and downtime costs are presented alongside output and quality numbers in the same review, downtime is no longer treated as a separate problem.
Continuous improvement loops. Total productive maintenance (TPM) principles such as autonomous maintenance and workplace safety, regular RCA on repeat failures, and structured post-incident reviews prevent the gains from each new initiative from quietly eroding over time.
How to Measure Progress in Reducing Equipment Downtime (KPIs)
To prove your strategies to reduce unplanned equipment downtime are working, you have to regularly track the right KPIs inside your CMMS:
MTBF tracks asset reliability over time. A rising MTBF on a given asset is one of the clearest signs that PM or PdM investment is paying off.
MTTR measures the efficiency of the maintenance response once a failure occurs. Industry benchmarks put a good average MTTR at five hours or less, although the right target varies heavily by equipment type and line size.
OEE is the combined measure of availability, performance, and quality discussed earlier, and the single best top-line indicator of whether your downtime reduction strategy is translating into tangible output gains.
Planned vs. unplanned maintenance ratio is a direct read on the maturity of your PM program. A higher share of planned work relative to unplanned, emergency work signals a more proactive operation.
Downtime cost per asset ties lost production time to the money spent on each specific machine or line, making it easier to prioritize capital and labor for the assets that cause the most financial damage when they go down.
Bottom Line
Reducing equipment downtime is an ongoing discipline that combines strong strategy, data, and culture across maintenance, operations, and procurement. Plants that shift from reactive repairs to preventive and predictive maintenance, backed by clean CMMS data and criticality-based prioritization, consistently see fewer surprise stops, shorter repair times, and stronger OEE scores. Those that still treat downtime as an unavoidable cost of doing business leave the most money on the table.
Stop losing valuable production hours to preventable unplanned breakdowns. Switch from reactive repairs to a data-driven strategy to start seeing real results. Not sure where to start? Book a free trial or demo with UpKeep today and reclaim your production floor.
Frequently Asked Questions
What is idle downtime, and how is it different from unplanned downtime?
Idle downtime refers to periods when equipment is available and capable of running but isn't producing, often due to a lack of materials, orders, or operators. Unplanned downtime occurs when something breaks down or stops working. The distinction matters for tracking, since lumping in idle time with genuine failures will skew downtime and OEE numbers and make root cause analysis harder.
What are the hidden costs of equipment downtime beyond repair bills?
The immediate repair is usually the smallest piece of the total expense. Hidden costs include idle labor still being paid during stoppage, emergency parts purchased at a premium, overtime to catch up on missed production, scrap and rework from a hard restart, contractual penalties for late shipments, and longer-term reputational damage with customers.
What is the fastest way to reduce unplanned equipment downtime?
For most plants, the fastest measurable gains come from tightening the existing preventive maintenance schedule and closing inventory gaps for critical spare parts. These address two of the most common, easily controllable causes of unplanned stops: deferred maintenance and extended repair times due to waiting on parts. Predictive maintenance technology delivers greater long-term reductions but takes longer to deploy and fine-tune.
How does a CMMS help reduce equipment downtime?
A CMMS centralizes asset history, work orders, and failure data in one place, enabling you to spot recurring failure patterns, schedule PM tasks automatically, and track MTBF and MTTR by asset. That visibility supports better root cause analysis and gives maintenance and operations teams a shared, accurate picture of equipment condition, rather than relying on memory or disconnected spreadsheets.
When should you replace aging equipment rather than continue repairing it?
It's generally time to consider replacement when repair frequency and MTTR on a given asset keep climbing despite consistent PM or PdM investment, or when the downtime cost per asset for that machine consistently outweighs the cost of a planned replacement or rebuild over a comparable period. Aging equipment and component wear are top drivers of unplanned stops, and that risk compounds the longer an asset stays in service past its reliable working life.
4,000+ COMPANIES RELY ON ASSET OPERATIONS MANAGEMENT
Leading the Way to a Better Future for Maintenance and Reliability
Your asset and equipment data doesn't belong in a silo. UpKeep makes it simple to see where everything stands, all in one place. That means less guesswork and more time to focus on what matters.






![[Review Badge] Gartner Peer Insights (Dark)](https://www.datocms-assets.com/38028/1673900494-gartner-logo-dark.png?auto=compress&fm=webp&w=336)