Blog Post
How to Track Downtime (and What It's Actually Costing You)
Downtime tracking is a broad umbrella. Learn what it covers, the most important metrics to monitor for it, and how to build a program to keep your equipment in good health.



Key Takeaways
Downtime tracking logs every planned or unplanned stoppage with a reason code assigned the moment it happens.
Equipment failure causes roughly 42% of unplanned downtime, and unplanned stops cost about 35% more per minute than planned ones, making accurate classification crucial for cost savings.
The best downtime tracking software combines automatic stop detection, fast operator reason-capture, and direct integration with your CMMS so a detected stop can trigger a work order without manual re-entry.
A machine going down for 10 minutes rarely feels like a crisis. But when enough stops string together across a shift, they add up to the biggest obstacle most plants face to improving output without buying new equipment.
The problem is most facilities know downtime happened, but not why, how often, or what it's really costing. Downtime tracking clears out that fog, turning an observed pattern into a prioritized, dollar-quantified list of what to fix first.
What Is Downtime Tracking?
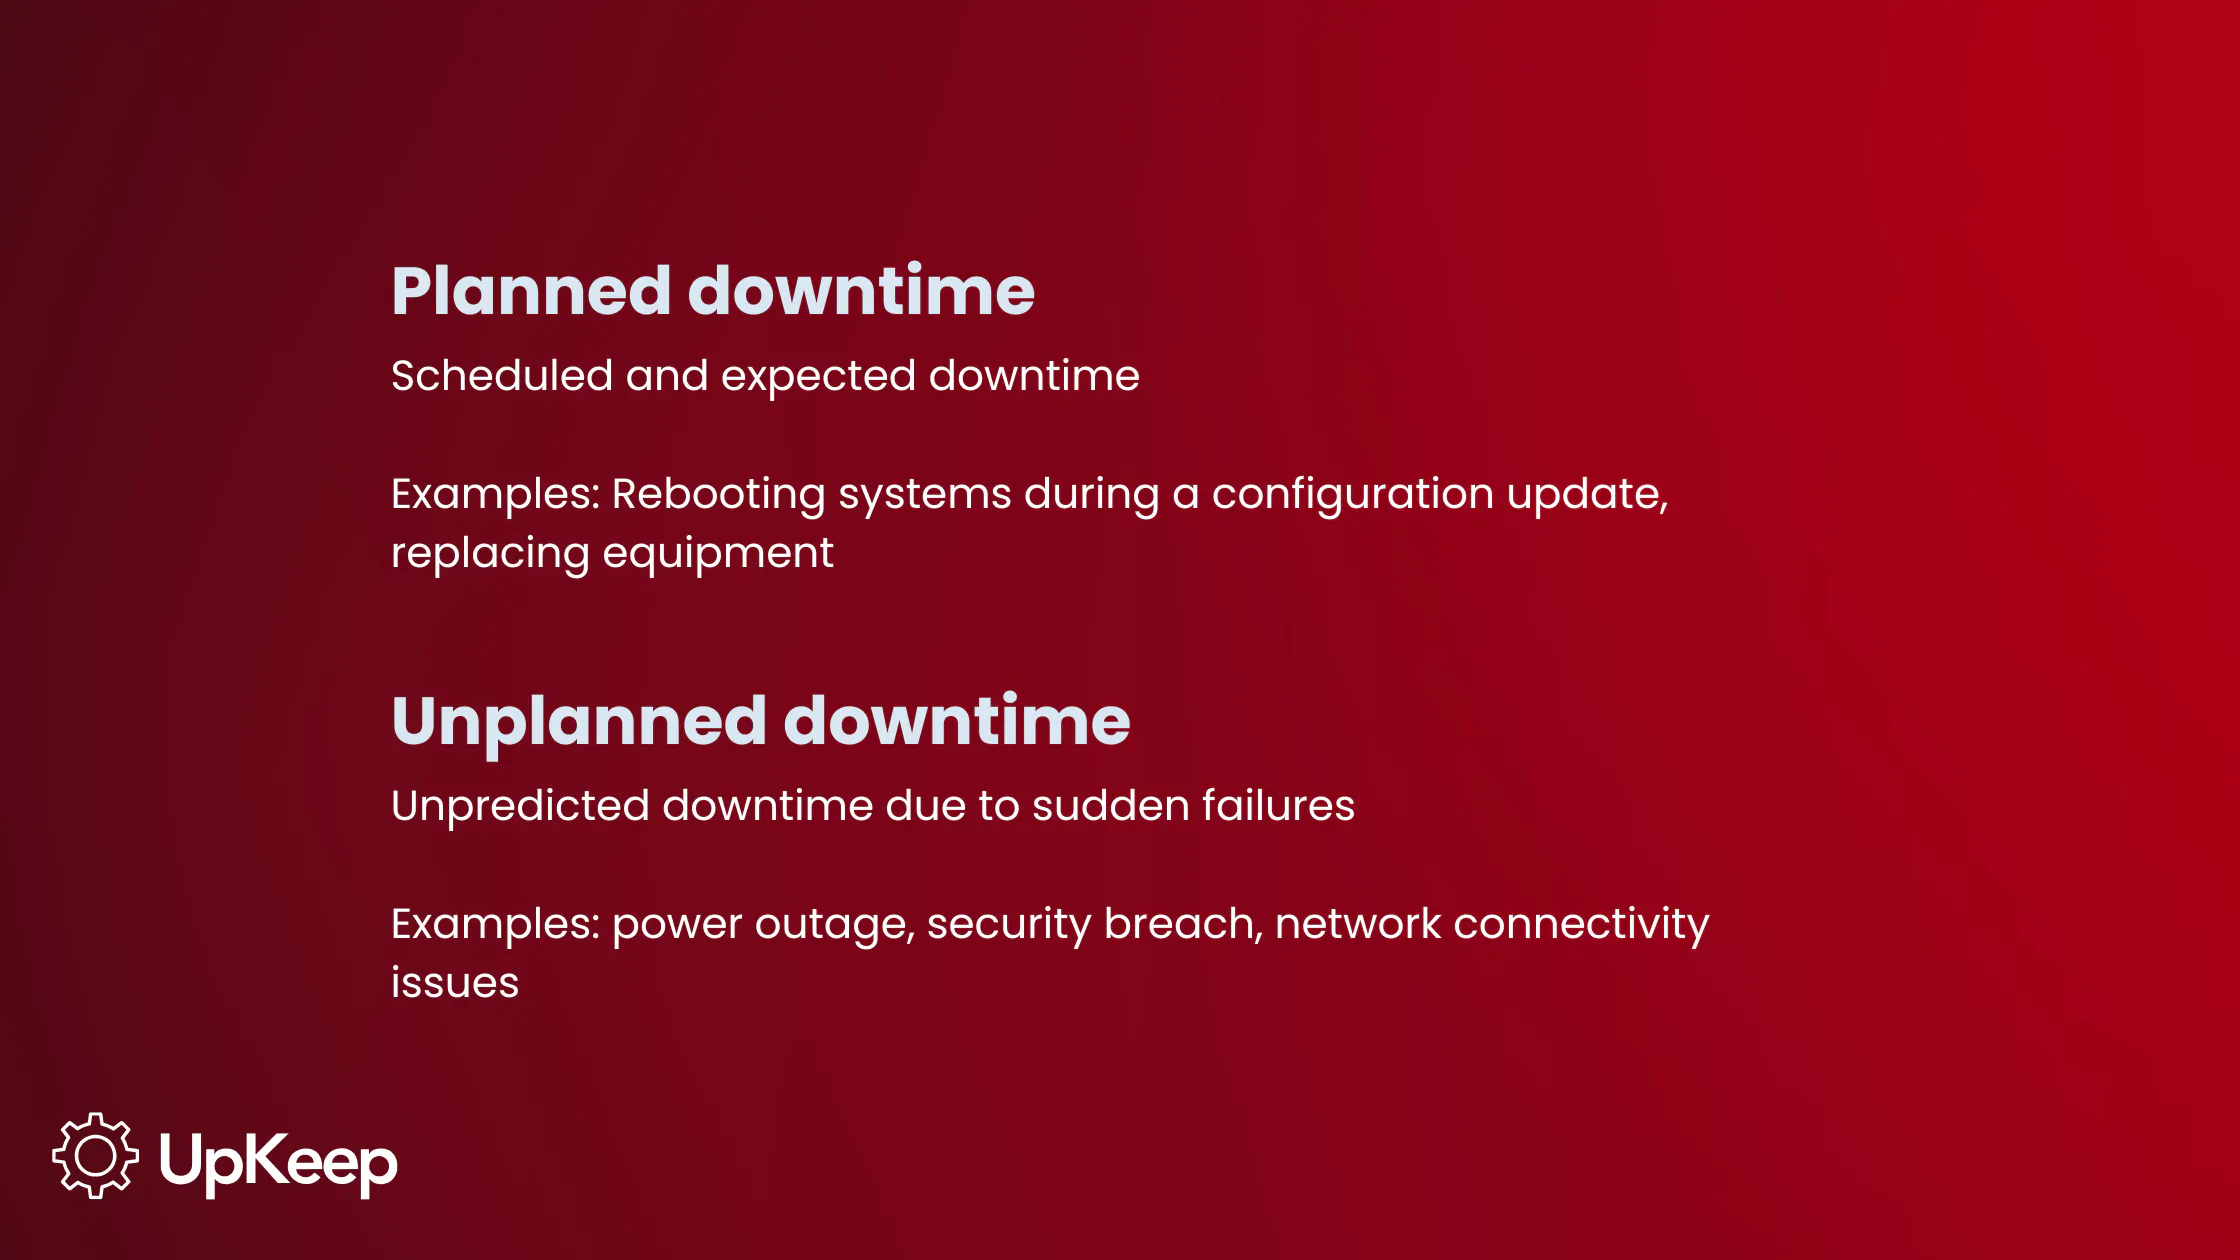
Downtime tracking logs every instance when a machine, line, or facility stops functioning. This includes capturing planned stops (like changeovers, preventive maintenance, or staff breaks) separately from unplanned ones (such as failures, jams, or material shortages). The distinction is important because the two require completely different strategies: Planned downtime is an optimization problem, while unplanned downtime is a prevention issue.
Every stop event should get a reason code the moment it happens. Reconstructing the "why" from memory is where most manual logs fall apart due to incorrect details, forgotten short stops, and reason codes turning into best guesses. That’s why 42% of all unplanned downtime is due to equipment problems, as well as why a taxonomy that reliably captures failure type is often the single highest-value data a plant collects.
Downtime tracking is also the raw input for overall equipment effectiveness (OEE). Without accurate stop logs, your availability, performance, and quality scores aren’t reliable. Tracking affects problem-solving and performance reporting down the line, so inaccurate data at this point could mean misinformed decision-making later on.


Downtime Categories: Planned, Unplanned, and Micro-Stops
Pay attention to the different types of downtime, because lumping every stop into one bucket can make your data useless:
Unplanned downtime covers equipment failure, tooling breaks, operator shortages, material stockouts, and power loss. Contrary to what cyberattack headlines suggest, the real drivers are more mundane, such as misconfigurations, network issues, and everyday maintenance errors.
Planned downtime covers scheduled preventive maintenance, changeovers, breaks, and upgrades. Unplanned stops cost roughly 35% more each minute than planned ones because they trigger emergency labor, expedited parts, and cascading schedule disruption that a planned stop simply doesn't create.
Then there's the category often forgotten in logs: minor stops, or micro-stops. These are sub-two-minute interruptions like jams, misfeeds, and sensor faults that operators skip because each feels too small to matter. These are one of the "Six Big Losses" in the TPM framework, and they silently erode your performance score even when availability looks fine. Closely related is speed loss, which can be invisible on a basic uptime/downtime log but is immediately visible once you do the OEE math.
These distinctions are why you need to establish taxonomy discipline before you touch any software; reclassifying even a portion of "unplanned" stops as poorly scheduled "planned" ones (or the reverse) can swing your availability metric by several points. A deeply configurable system like UpKeep pays off here. Customizable reason-code taxonomies and work order types let you build categories around how your operation actually runs, instead of a generic stop-code list.
Manual and Automated Methods for Tracking Machine Downtime
How you capture downtime data matters almost as much as how you categorize it. Most plants sit somewhere on a spectrum from manual to fully automated:
Paper logs are the cheapest way to start: An operator writes stop start/end times on a clipboard or whiteboard. Timing is key here. Operators typically log after restarting, not during the stop, which introduces rounding errors and drops the micro-stops. Spreadsheet or shared-doc logs centralize that same manual entry, which improves reporting but is still fully dependent on human diligence and just as prone to error.
CMMS-based logging is a step up: Work orders and downtime events live in one system tied directly to asset history, so a stop automatically links to that machine's maintenance record instead of floating in a log nobody cross-references. Hardware sensors and PLC integration take it further, automatically detecting stop and start states from the machine's control signal, requiring no operator action.
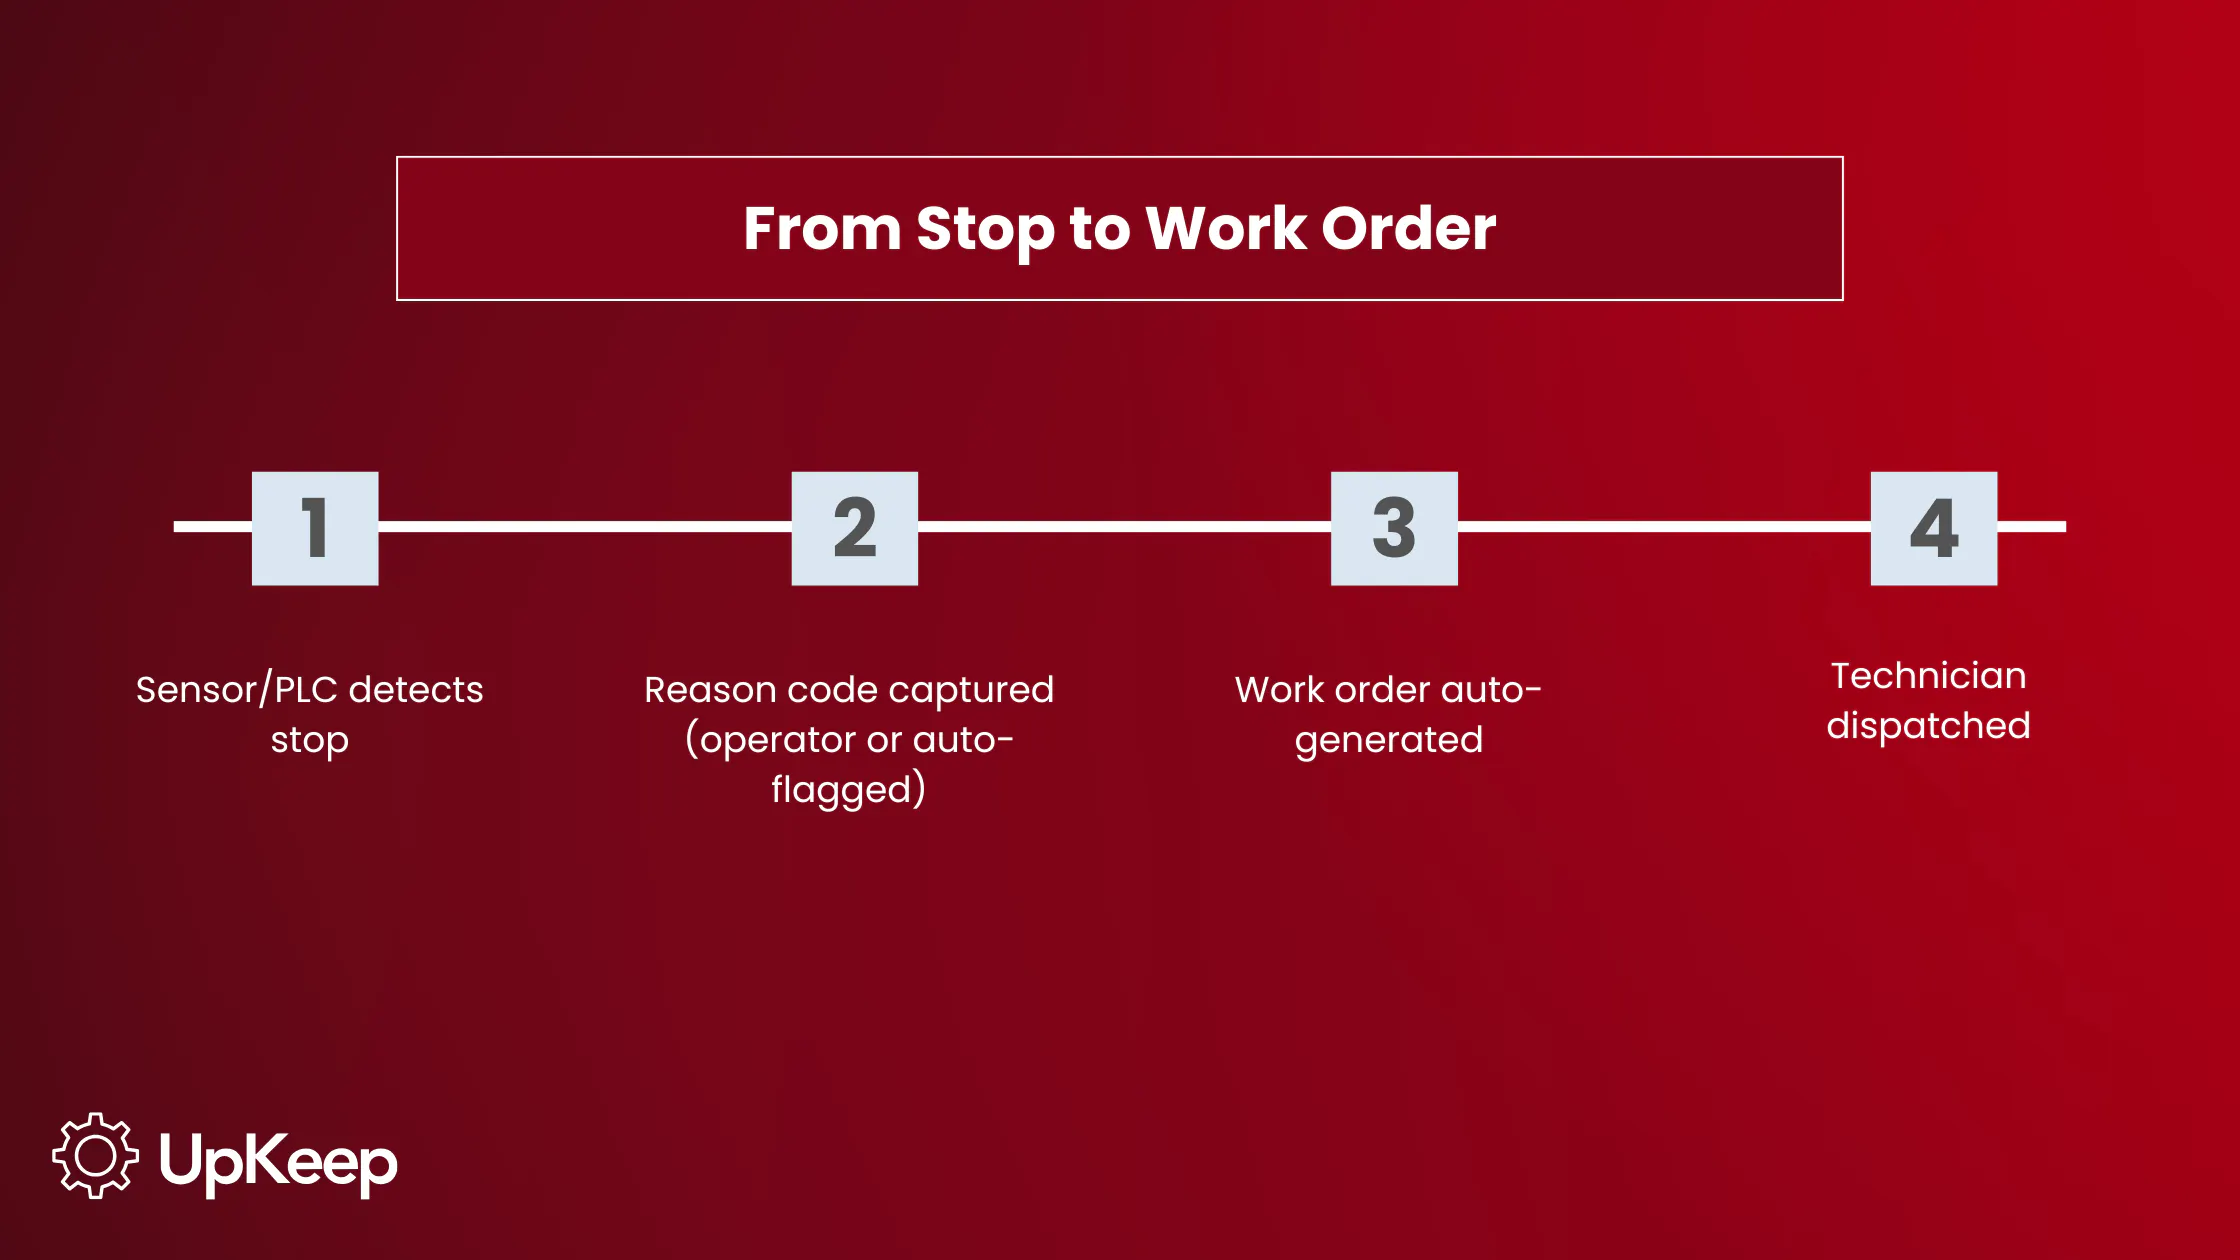
Automated detection is what actually catches the sub-two-minute stops that manual methods consistently miss, since no human has to remember to write it down. The most effective setups connect both. UpKeep, for example, sits between automated stop detection (sensors, PLC, or Edge devices) and your work order system, so a detected stop can auto-generate a ticket without anyone entering the same information twice.

The Downtime Metrics That Matter: MTBF, MTTR, and OEE Explained
Once you're capturing clean data, there are several key metrics that turn it into something actionable:
Mean time between failures (MTBF) is total uptime divided by number of failures. It tells you how reliable an asset runs. A rising MTBF over time is one of the clearest signs a maintenance program is maturing well.
Mean time to repair (MTTR) is total repair time divided by number of repairs, measuring how fast you recover once something breaks. An optimal average industrial MTTR sits around two hours or less, although it varies by equipment type and industry.
Overall equipment effectiveness (OEE) multiplies availability by performance and quality to calculate one score. The widely cited world-class benchmark is 85%, comprising roughly 90% availability, 95% performance, and 99% quality. Most manufacturing companies, however, operate closer to a 60% OEE score.
Downtime by reason code and Pareto analysis is where data starts driving decisions instead of describing history. Reason codes diagnose causes, detect issues in real time, and reveal recurring patterns. Then, Pareto analysis comes into play. It’s a simplified decision-making tool to strategically select which problems to prioritize using the 80/20 rule, where 80% of the benefit comes from doing 20% of the possible work.
The planned-versus-unplanned ratio shows what kind of maintenance program you're running. Heavy unplanned downtime indicates reactive maintenance, while more planned downtime with fewer unplanned incidents reveals a mature, proactive program.


The Real Cost of Machine Downtime
The financial case for tracking downtime starts with a straightforward formula: Downtime Cost = (Lost Production Value/Hour + Labor Cost/Hour + Overhead/Hour) × Downtime Duration. You also need to add in repair costs, scrap/waste, and supply chain penalties. Although it's a simple equation, many plants still don't calculate consistently, which is part of why downtime is chronically underestimated.
More than 6 in 10 manufacturers experienced unplanned downtime within the past year, costing the industry up to $852 million per week. Once a line goes down, recovery adds its own cost layer; catching up often means overtime labor at 1.5–2 times the typical rates, on top of the original lost output. Quality problems compound the bill further. Recalibration issues and off-spec first batches are common right after a hard, unplanned stop, frequently producing higher scrap rates.
The ripple effect is often the most underestimated cost of all. Chronic downtime on a single bottleneck machine caps output for every process downstream of it. A stop that looks minor and short can quietly impact three other work centers. In fact, 39% of maintenance leaders report downtime is getting more expensive even as AI adoption rises, which suggests tooling alone isn't the fix. Process and data discipline are what actually move the needle.
How to Implement a Downtime Tracking Program
1. Build a standardized reason-code taxonomy before collecting any data
Start by pulling your historical stop data, maintenance logs, and operator interviews to identify the failure modes and stoppage types that actually occur on your floor, rather than adopting a generic template.
Group those findings into a tiered structure, such as a small set of high-level categories (like "mechanical," "electrical," "material," and "operator") each broken into a handful of specific sub-codes (such as "bearing failure" or "belt slippage" under mechanical). This keeps the list short enough to scan quickly while still capturing the detail a Pareto analysis needs later.
Aim for roughly 15-25 total codes as a starting point for most production lines, then revisit the list after a few months of real use. If operators consistently pick a catch-all code like "other" or "mechanical failure," that signals a sub-code is missing and needs to be added. If a code is never used, retire it.
Getting this taxonomy right before rollout is crucial because reclassifying historical data later is far more disruptive than adjusting the list up front, and it protects the accuracy of every metric built on top of it, including OEE, MTBF, and Pareto charts.
2. Train operators on why accurate coding matters
Run a short training session that walks operators through how reason codes flow into repair priorities and scheduling decisions. When operators can see that a code they log in the afternoon on the line they run every day directly shapes which repairs are scheduled first, they log more consistently and take more care selecting the right one. Meanwhile, operators who treat the codes as a formality to click past tend to pick whatever option is fastest, which quietly degrades the entire dataset.
Reinforce this with a quick feedback loop: Share a monthly summary showing operators how their reason-code data contributed to a specific fix, like a bearing that was replaced before it failed because their logs flagged the pattern. Seeing the downstream result of their own data entry turns coding from an abstract obligation into a visible, worthwhile habit.
3. Start with your highest-impact assets
Rather than rolling out plant-wide tracking on day one, identify three to five machines responsible for the most downtime hours or the most costly stops. Use whatever historical data you already have to make this shortlist, even if it's incomplete. Since equipment failure drives nearly half of all unplanned downtime, these worst-offending assets are usually where you see the fastest and most visible payoffs from a taxonomy and tracking discipline.
Deploy full tracking (i.e., reason codes, sensors, if available, and dashboards) on this smaller set first, then use the early wins to build your case. For example, identifying a specific failure pattern and fixing it within the first month helps secure the buy-in needed to expand tracking to the rest of the facility.
4. Review downtime Pareto charts on a fixed weekly cadence
Set a recurring meeting where the reliability engineer or maintenance lead pulls the current Pareto chart and walks through the top three to five reason codes by cost or frequency. A chart reviewed sporadically loses its value because emerging patterns get missed between check-ins, so consistent monitoring is key.
Beyond maintenance, the downtime data refines production scheduling by replacing optimistic assumptions with real historical performance. MTBF averages pulled from your logs can set realistic buffer windows in a schedule. Instead of assuming a line runs flawlessly for eight hours, planners build in buffer time based on historical failure patterns, producing capacity plans that hold up under real-world conditions.
5. Run root cause analyses on your top three recurring stop reasons
Once your weekly Pareto review pinpoints the reason codes appearing again and again, pick the top three by total cost or downtime hours and run a structured root cause analysis on each, such as a "5 Whys" exercise or a fishbone diagram. Involve the technicians and operators closest to that equipment in the process as well. Document the root cause, the corrective action taken, and the expected impact, then track whether that reason code's frequency drops in the following weeks.
Do this before expanding your tracking scope any further. Closing the loop on even three chronic issues typically leads to more measurable downtime reduction than adding tracking to another 10 machines.
Downtime Tracking Rollout Checklist
|
Action |
Owner |
Cadence |
|
Build a standardized reason-code taxonomy |
Maintenance lead |
One-time setup |
|
Train operators on why coding matters |
Shift supervisor |
Before going live |
|
Start with the highest-impact assets |
Plant manager |
One-time setup |
|
Review downtime Pareto charts |
Reliability engineer |
Weekly |
|
Run root cause analysis on top 3 stop reasons |
Maintenance lead |
Monthly |
What to Look for in Downtime Tracking Software
Different downtime tracking tools can solve different problems, so evaluate software against the specific failure points manual tracking runs into:
Automatic stop detection on legacy equipment should work through retrofit sensors rather than requiring a full PLC replacement. Few plants can justify a hardware overhaul purely for downtime visibility.
Fast operator reason-capture is non-negotiable; if logging a reason takes more than a few taps, operators skip it and backfill later, if at all.
Role-based real-time dashboards matter because stakeholders need different views of the same data. Operators need what's down right now, supervisors need shift-level Pareto views, and plant managers need trended OEE and cost data.
Perhaps most important is CMMS and IoT sensor integration that auto-generates work orders. Vibration, temperature, and current-draw sensors can be configured to log a downtime event the moment a threshold is breached, and from there a detected stop should create a work order without manual re-entry, closing the loop between detection and repair.
Threshold-based alerting and escalation notifies the right person automatically once a stop exceeds a defined duration, rather than depending on someone noticing.
The Bottom Line for Downtime Tracking
Getting downtime tracking right requires a few connected fundamentals. Those are building a taxonomy specific enough to drive real decisions, capturing stops through a mix of fast operator input and automated sensor detection, turning that data into metrics like MTBF, MTTR, and OEE, and using regular Pareto reviews and root cause analyses to work through the biggest problems first. Each of these steps contributes value to get the most out of your program and keep your assets running strong.
However, downtime tracking only pays off when categories are clean, data capture is fast enough for operators to actually use, and the system connects detection to action automatically. That's the combination UpKeep is built around: configurable reason-code taxonomies, sensor and Edge-based detection, and a CMMS that turns a detected stop directly into a work order your team can act on.
Explore UpKeep's asset operations platform to see what your downtime is really costing you by starting a free trial.
Frequently Asked Questions About Downtime Tracking
What does downtime mean?
Downtime is any period when a machine, line, or facility isn't producing output, whether due to a scheduled stop like maintenance or an unexpected one like equipment failure. It's measured from the moment production stops to the moment it resumes. Downtime can range from a sensor fault lasting seconds to a multi-day outage requiring parts, repairs, or specialized labor to resolve.
How do you measure downtime?
Measure downtime by logging the start and end time of every stop, along with a reason code assigned as close to the moment it happens as possible, then rolling that data into metrics like MTBF, MTTR, and OEE. These metrics reveal patterns across time, assets, or shifts, showing not how much downtime occurred and which causes, machines, or teams are driving it.
Why is downtime tracking important?
Without accurate data, teams can't tell which stops cost the most money, whether their maintenance strategy is reactive or proactive, or where to focus limited resources for the biggest impact. Tracking turns a vague assessment into a prioritized, dollar-quantified list of specific problems. That then lets maintenance and operations leaders make investment decisions based on hard evidence instead of gut feel.
What are examples of downtime?
Examples include equipment failures like a motor burning out or a bearing seizing, tooling breaks, material or operator shortages that halt a line, and scheduled events like preventive maintenance and changeovers. Short micro-stops, such as jams, misfeeds, or sensor faults lasting under two minutes, also count as downtime, even though they're frequently overlooked in manual logs because they feel too minor to record.
4,000+ COMPANIES RELY ON ASSET OPERATIONS MANAGEMENT
Leading the Way to a Better Future for Maintenance and Reliability
Your asset and equipment data doesn't belong in a silo. UpKeep makes it simple to see where everything stands, all in one place. That means less guesswork and more time to focus on what matters.






![[Review Badge] Gartner Peer Insights (Dark)](https://www.datocms-assets.com/38028/1673900494-gartner-logo-dark.png?auto=compress&fm=webp&w=336)