Blog Post
Condition Monitoring and Predictive Maintenance Explained
Discover how condition monitoring and predictive maintenance work together to reduce unplanned downtime, optimize asset health, and streamline repairs.



Key Takeaways
Adding repair history to condition monitoring trends turns a rising reading into a repair date. With that date in hand, your planner can order parts and book labor around it.
Readings cut unplanned downtime once each alert lands in the work order queue. When the work order already shows the reading, the technician knows what changed before reaching the asset.
Choose what to measure on each asset by how it's likely to fail. An asset that wears out over weeks can stay on a technician's route, while one that can fail in days calls for a fixed sensor.
Start with five to ten critical assets and expand once their alerts reliably become planned repairs. Sort your assets by what a failure would cost, and the pilot comes from the top of that list.
Imagine a conveyor motor trips halfway through a shift. It takes an hour to trace the fault to the drive-end bearing. Then, the replacement is two days out, so the line waits. Only then does someone notice that vibration had climbed on three route visits; those readings sat in a log with no work order attached.
Condition monitoring could have flagged that climb on the second visit. With the motor’s repair history alongside the trend, predictive maintenance would’ve then estimated how much running time remained, early enough to schedule the work before the bearing failed. When these two elements work hand-in-hand, things quiet down for your assets.
Condition Monitoring vs. Predictive Maintenance
Condition monitoring tracks an asset's health through regular readings like vibration, temperature, oil condition, pressure, or motor current. The readings come from fixed sensors, lab samples, or a technician who walks a route past the same marked points each visit.
Predictive maintenance (PdM) looks at how those readings change over time, adds the asset's repair history, and forecasts when wear will get bad enough to need a repair. That forecast usually comes from a reliability engineer, or a lead technician on smaller teams, and it gives your maintenance planner a date to schedule against.
Condition-based maintenance uses the same readings but acts on the current value alone, with no forecast. When a CNC spindle's temperature passes its alert limit, the value set to trigger a response, a technician checks the spindle that shifted.
Condition monitoring and predictive maintenance run alongside preventive maintenance (PM) on fixed calendar or meter intervals. Fixed intervals suit filters in a clean, steady environment, where they load up at a predictable rate. Condition monitoring spots wear that doesn't keep to a fixed interval, like a bearing on a misaligned shaft that wears out long before its next service. A typical plant runs preventive and condition-based maintenance side by side, with each asset on the approach that fits how it fails and what a failure costs.
Why Condition Monitoring Matters to Maintenance Teams
When a reading starts changing weeks before a failure, that’s your warning to book the repair for a scheduled stop. The storeroom can order the part at its normal lead time, and when the technician opens the work order, the likely cause is already written on it.
A planned repair costs parts and a few hours of labor. Mid-shift, the same repair adds overtime, rush freight on the parts, and every hour of production lost while the equipment sits.
Monitoring saves work on healthy equipment too. A motor with steady readings can keep running past its calendar rebuild date. When an asset does need work, a technician who confirms the cause before pulling parts leaves the good ones in service. Over a year, the result is fewer emergency jobs breaking into the schedule and more of your team's hours going to planned work.
What Condition Monitoring Measures
Each type of reading catches a different kind of fault, so start with the asset's likely failure modes, such as a seized bearing, a slipping belt, or a loose connection. The table pairs common ones with the reading that tends to move first.
|
How the asset fails |
What changes first |
How to measure it |
Keep readings comparable |
|---|---|---|---|
|
Bearing wear, looseness, or misalignment |
Vibration rises |
Vibration meter on a route, or a fixed sensor |
Same marked point, speed, and load |
|
Refrigeration losing capacity |
Temperature climbs or recovers slowly |
Temperature sensor with trend history |
Ignore brief rises from door openings and defrost cycles |
|
Loose or overloaded electrical connections |
A hot spot appears |
Infrared camera |
Same load at each scan; note nearby heat sources |
|
Air leaks or under-greased bearings |
High-frequency sound changes |
Ultrasound instrument (detects sound above human hearing) |
Same listening point and instrument settings |
|
Internal wear or contaminated oil |
Metal particles or water show up in the oil |
Oil sample sent to a lab |
Same sample point and interval |
|
Pump, fan, or motor straining against a blockage or added load |
Current, pressure, or flow changes |
Control system values or a current sensor |
Same speed and flow demand |
Shiny surfaces throw infrared readings off. Polished metal gives off little infrared of its own and reflects heat from nearby equipment, so a stainless motor cover can read cooler than it is, or hot when it isn't. The technician sticks a strip of electrical tape on the cover and reads the tape. Its dull surface shows the true temperature.
Current, pressure, and flow can be the cheapest readings to start with. In many plants, those values already sit in the building automation system or the line's control system. On a positive-displacement pump, for example, motor current that creeps up while output holds steady can mean it's pushing against a partly blocked discharge line.
Baselines, Trends, and Alert Limits
Each trend starts from a baseline taken while the asset runs well, with the speed, load, and measurement point written down next to it. Later readings only compare fairly when the machine is running the same way, because a motor at full load shakes and heats differently from one idling.
A single high reading sends someone back to recheck the meter, while a steady climb across several route visits is much harder to argue with. Say a 75 hp exhaust fan shows vibration at the fan bearing creeping up on each weekly route while speed and load hold steady. On an exhaust fan, that's a common sign of dust on the blades throwing them off balance. The technician rules out a loose sensor and checks the blades.
Alert limits decide what reaches a technician without anyone having to study a graph. A reading well over its limit needs someone there this shift. A slow climb like the fan's can stay under its alert limit for weeks. The reliability engineer catches it at the monthly trend review. Where the system supports one, a rate-of-change alert flags that kind of climb without waiting for the review. It sounds when a reading rises faster than normal, even before it crosses the limit.
Limits also need to match how the machine runs. A centrifuge that pulls high current every time it spins up needs its own startup limit, or a short delay before the alert sounds. That keeps a normal spin-up from sending a technician to check a centrifuge that's working fine.
Finding the Cause and Forecasting the Repair
Once anomaly detection flags a reading that has moved away from the asset's normal behavior, the reliability engineer works out why. On a vibration rise, vibration analysis breaks the reading into frequencies that point to the likely cause, such as imbalance, misalignment, or looseness. With the cause known, a forecast tells the planner how long the asset can keep running.
When the fan's blades turn out dusty, a forecast can be as simple as extending the trend line. If vibration has climbed about the same amount every week, you can see roughly when it'll hit the alert limit and book a cleaning and balance a week or two ahead of it. The projection holds only while readings are taken under the same conditions, so the engineer redraws it after every route visit and checks it against the fan's repair history. On assets with fixed sensors, predictive maintenance software can redraw that projection each time a new reading arrives.
If the blades turn out clean, diagnosis may end with "we need one more test." The planner schedules it, and the work order says what's known so far: "Vibration rising at fan bearing, blades clean, cause unconfirmed." The technician then shows up ready to check balance and mounting before anyone reaches for a new bearing.
What Happens After a Condition Alert


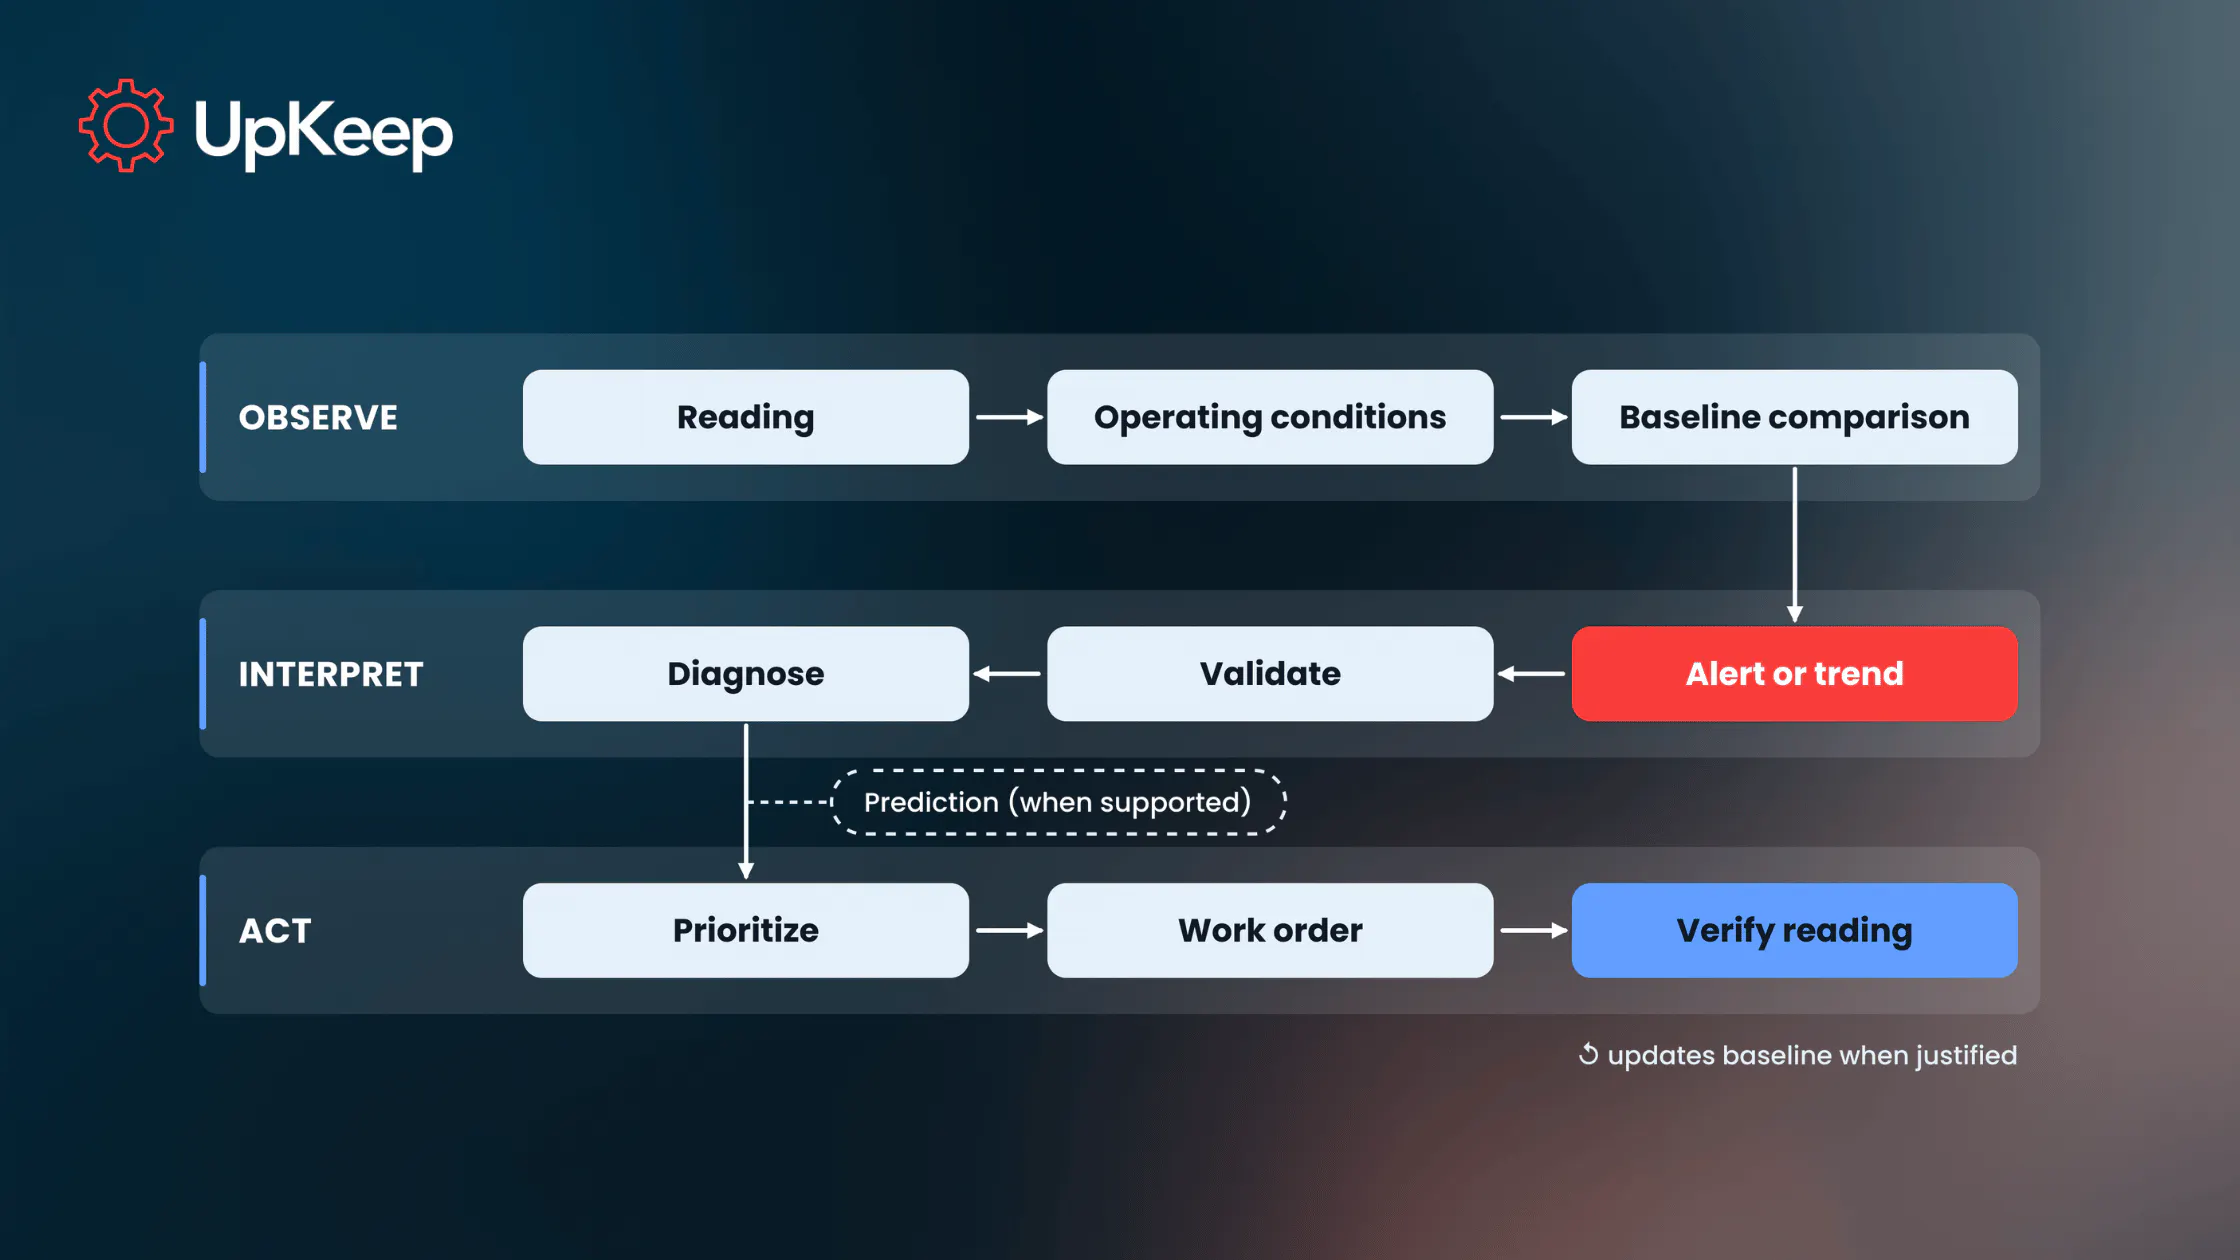
Once a reading crosses its alert limit or a trend starts climbing, it needs to become a work order in your computerized maintenance management system (CMMS), opened by a technician or automatically by the monitoring system. The work order carries the asset, the reading or trend, the operating conditions, and why it stood out. Five steps take it from there to a verified repair:
Confirm the Reading: The technician makes sure the reading is real by checking the sensor mounting, the measurement point, and whether the machine was at its usual speed and load.
Diagnose the Cause: The technician or reliability engineer inspects the asset, the same shift for an urgent alert or at the next scheduled visit for a slow trend, and writes down what's confirmed and what's still open.
Prioritize and Plan: With the inspection done, the planner weighs safety, the production schedule, whether the crew can reach the equipment, and how much warning time is left, then books the job into the current shift, the next planned stop, or a later outage.
Complete and Document the Work: Before closing the work order, the technician who did the job records the repair, the confirmed cause, and any follow-up.
Verify the Result: After the repair, the technician takes the reading again at the same marked point, speed, and load. If the repair changed how the asset normally runs, the reliability engineer resets the baseline from that reading.
What to Track
At the monthly trend review, your reliability engineer checks the following numbers for the monitored assets:
Alert-to-Inspection Time: How long an alert waits before someone inspects the asset. The shorter it is, the more warning time is left to plan the repair.
Alert Outcomes: The share of alerts that end in a repair, a recheck, or a note saying no action was needed. An alert with none of these is dropped, and if no-action notes pile up, the limit is probably set too tight.
Planned Work and Downtime on Monitored Assets: The share of work on those assets that was scheduled ahead, tracked next to their unplanned downtime hours. Compare similar operating periods, since a quiet production month lowers downtime on its own.
Over a longer stretch, mean time between failures (MTBF) on monitored assets shows whether repairs are landing before breakdowns. Once the pilot grows, add mean time to repair (MTTR) and maintenance cost to the predictive maintenance KPIs you report.
How to Start Condition Monitoring on Your First Assets
Start small. A pilot on a handful of critical assets gives the team time to tune alert limits and route timing before more equipment comes on. As the maintenance manager, you own the rollout, and your reliability engineer or lead technician handles the technical setup.
1. Rank Assets by Criticality: In the first week, rank your equipment by how badly a failure would hit safety, production, stored product, or the equipment around it. In a bakery, the only tunnel oven lands near the top of a criticality ranking like that. A restroom hand dryer with a spare on the shelf can stay on run-to-failure and get fixed when it stops. Your top five to ten assets become the pilot.
2. List How Each Asset Fails: That same week, have your reliability engineer list each pilot asset's likely failure modes from its repair history and what your technicians have seen. On the tunnel oven, that list might include drive-motor bearing wear and an overheating connection in the electrical panel.
3. Pick the Reading That Changes First: Next, the engineer matches each failure mode to the reading that shows it earliest and estimates how much warning that reading gives, which reliability engineers call the P-F interval. Industry guidance commonly recommends at least two checks in that time. Six weeks of warning means a route every three weeks or sooner, and a failure that develops in days needs a fixed sensor. Your most critical assets may justify two methods, such as vibration on the oven's drive motor plus infrared scans of its electrical panel.
4. Choose Sensors or Routes: Before you order vibration, temperature, pressure, or ultrasound sensors, list the assets that need them. That means the ones whose failures develop too fast for a route, plus anything that sits where nobody walks often, like a wastewater lift station at the edge of the site. Everything else goes on a technician route.
5. Take Baselines and Mark the Points: Before the first route, the technician takes a baseline on each asset while it's running normally, marks the measurement point with paint or a tag, and adds a photo of it to the route instructions. The mark keeps April's bearing-housing reading comparable with May's.
6. Set Alert Limits That Open Work Orders: Once the baselines are in, the engineer sets an alert limit for each reading in the CMMS, so anything over the limit puts a work order on that asset with the reading attached. Route readings entered on a phone land on the same asset record.
For instance, at HMSHost's LAX locations, sensors on the walk-in freezers showed one unit running high, and the team traced it to a broken fan and no refrigerant left in the system. The UpKeep maintenance team then set temperature limits, and now, an out-of-range reading opens a work order that the maintenance manager assigns to a technician.
7. Review Trends Monthly: Go over the month's trends with your reliability engineer and planner. Loosen any limit that keeps firing with nothing found, and decide when the next assets on your criticality list are ready for a wider predictive maintenance rollout.
From Mid-Shift Breakdowns to Planned Repairs
A trend can climb for weeks while the maintenance queue stays untouched
When multiple route readings feed a work order, a technician can check the root cause on a weekday afternoon with the line still running. A planner can order any necessary parts and schedule the swap for a weekend outage. The next reading would show the asset returned to its baseline. Across every monitored asset, those early catches add up to fewer unplanned downtime hours, a larger share of planned work, and a longer MTBF.
With UpKeep Edge's CMMS integration, the work order opened from a sensor alert already carries the sensor data and the asset's details. Every reading also sits on the asset record next to its maintenance history, so the monthly trend review shows each alert, repair and follow-up reading in one place.
Book a demo with UpKeep to see a sensor alert become a scheduled, verified repair.
FAQ
Can route readings support predictive maintenance?
Yes. A technician who takes readings at the same measurement points on every visit builds a trend without fixed sensors. If that trend and the asset's past repairs support a forecast, the planner can set the repair date before the failure. Routes suit problems that build over weeks, like gradual bearing wear, where each visit adds a point.
Can one sensor cover every failure mode?
No. A sensor measures one or two things and can miss a failure that another reading would catch. A vibration sensor tracks bearing wear, while gear wear often shows up first in an oil sample. List how the asset fails, then add a second method where the first reading misses a failure mode, beginning with your most critical assets.
Does condition monitoring replace preventive maintenance?
No. Calendar- and meter-based PM still makes sense for tasks tied to time or run hours, like lubrication rounds and required safety checks. Condition monitoring catches wear that outpaces those intervals, like a hoist brake wearing faster under heavier loads, and steady readings on an asset can justify spacing out its PM visits.
Is condition monitoring worth the cost?
It depends on the asset. Route readings with a handheld meter add little beyond technician time, while fixed sensors, software, and training cost more up front. Predictive maintenance pays back fastest on heavily used assets where downtime is expensive. Pilot there first, then compare those assets' unplanned downtime hours before and after.
When is run-to-failure a reasonable choice?
Run-to-failure maintenance can be considered when the equipment is cheap, has a spare on hand, and won't put people, production, or stored product at risk when it stops. Little warning before failure strengthens the case, because monitoring wouldn't catch much. A hallway door closer fits, since the team can replace it when it fails and nothing else stops.
4,000+ COMPANIES RELY ON ASSET OPERATIONS MANAGEMENT
Leading the Way to a Better Future for Maintenance and Reliability
Your asset and equipment data doesn't belong in a silo. UpKeep makes it simple to see where everything stands, all in one place. That means less guesswork and more time to focus on what matters.