Blog Post
How Infrared Predictive Maintenance Works and Why It Pays Off
Discover how infrared for predictive maintenance helps teams catch equipment failures early, cut downtime, and reduce maintenance costs.


Key Takeaways
Infrared thermography detects heat-based anomalies in electrical, mechanical, and structural assets before they cause failures, making it a core layer of any predictive maintenance program.
Infrared inspections require trained thermographers, calibrated equipment, and established baselines, and deliver the most value when integrated with vibration, ultrasound, and oil analysis data.
Facilities using infrared predictive maintenance can cut overall maintenance costs by up to 30% and see outsized returns, with some federal studies citing ROI as high as 10 times.
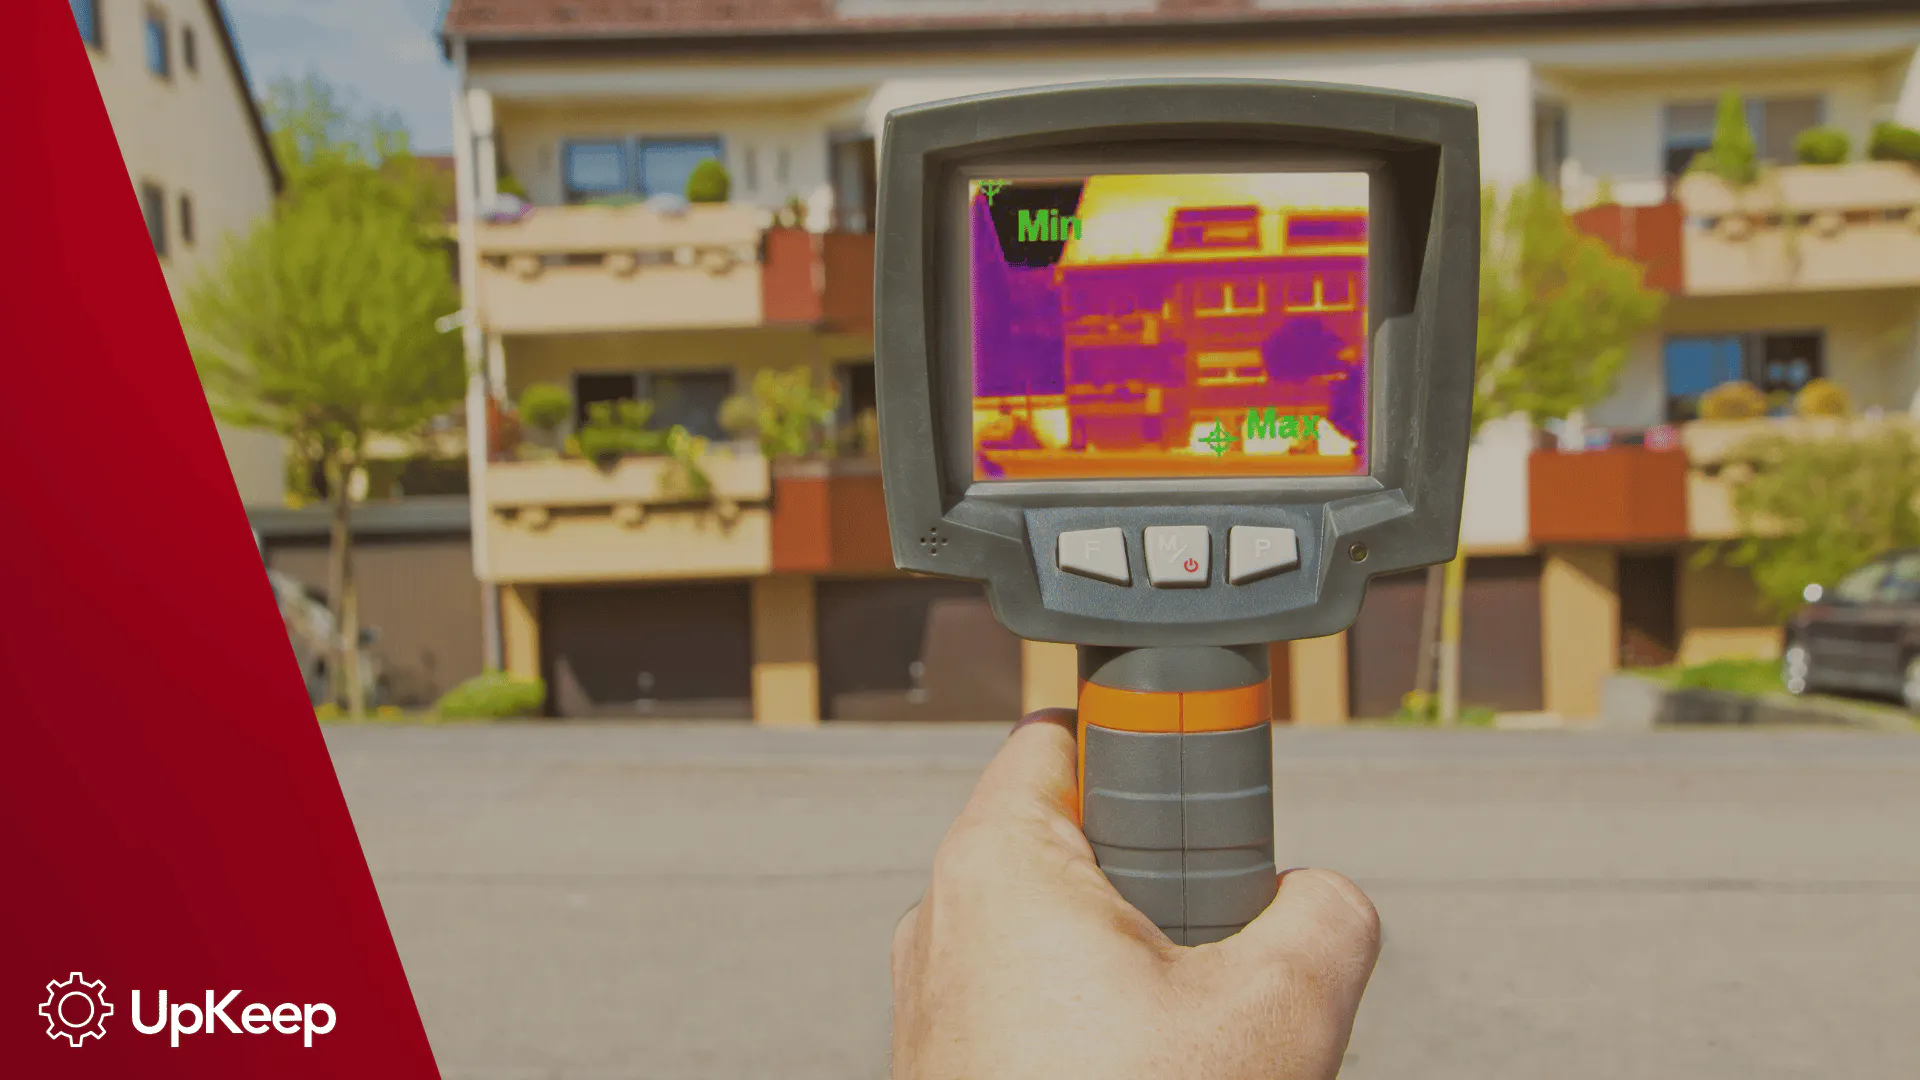
When an electrical connection starts to overheat, or a motor bearing begins to fail, the first sign of trouble is often invisible to the naked eye. However, it does show up as downtime, a damaged asset, or a safety incident. Infrared for predictive maintenance gives maintenance teams a way to catch that heat signature early, monitoring energized equipment without shutting it down.
This guide breaks down how infrared thermography works, what it can and can't detect, the tools required to run a program, and the kind of ROI companies can expect once they add its data into a connected maintenance system.
What Is Infrared Thermography in Predictive Maintenance?
Infrared thermography (IRT) is a non-contact inspection method that detects heat emitted by objects, revealing temperature anomalies that often signal mechanical, electrical, or structural degradation before a failure occurs. Because it doesn't require equipment to be shut down or opened up, thermographers can scan energized electrical panels, running motors, and operating pipelines without interrupting production.
Predictive maintenance (PdM) uses these thermal anomalies as triggers. Instead of waiting for a planned inspection or a breakdown, teams can schedule a repair the moment a hot or cold spot indicates a developing problem.
Infrared inspection works differently in PdM than preventive maintenance (PM). PM is based on a fixed schedule, regardless of an asset's actual condition. Infrared in PdM reflects real-time asset health, which helps reduce unnecessary work orders and catch problems before they escalate into emergencies.
But IRT isn't a replacement for a maintenance program. It’s one diagnostic layer within a broader PdM strategy, typically used alongside vibration analysis, ultrasound testing, and oil analysis.
When an infrared inspection turns up a fault, that finding should feed directly into a system that can act on it. In UpKeep, infrared findings populate the work order queue and attach to asset history, giving teams the context they need to make faster, more informed repair decisions.
What Do Infrared Inspections Detect?
Thermal cameras can sense a wide range of fault types across electrical, mechanical, and structural systems. Sometimes, IRT is the only way to prevent costly downtime or safety risks. For example:
Blocked steam traps, leaking valves, and heat exchanger fouling are among the most common mechanical findings in industrial plants.
Motor winding faults and unbalanced three-phase loads create asymmetric thermal profiles that are difficult to catch any other way.
Insulation voids, moisture intrusion, and air leaks create visible thermal contrasts in walls and roofs, revealing defects that are otherwise invisible.
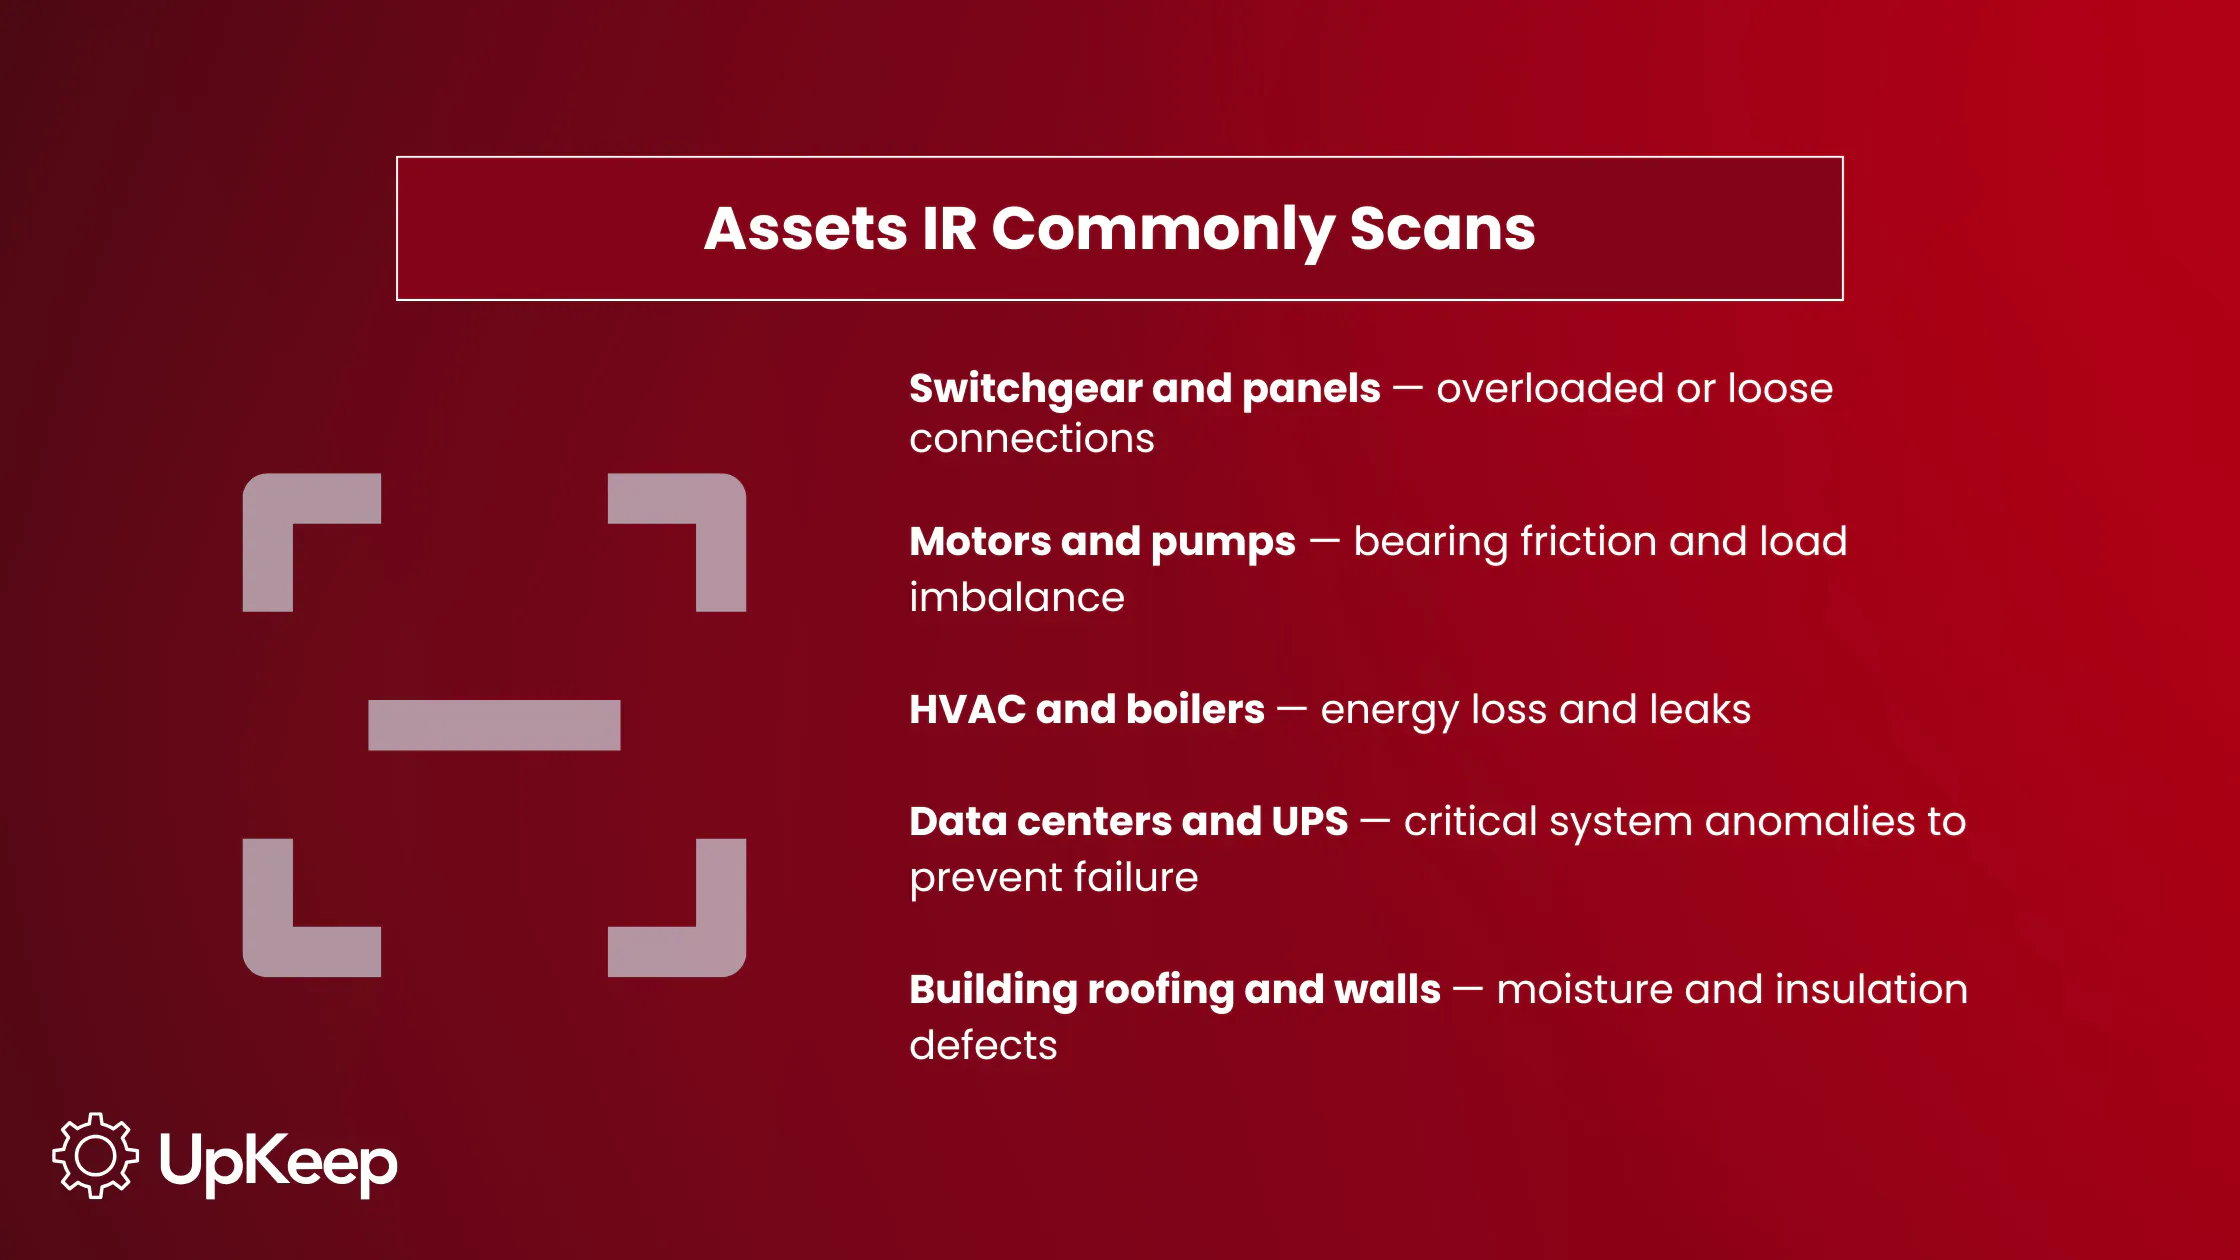
Electrical switchgear, transformers, and panel boards are the most frequent inspection targets, as electrical faults pose both safety and fire risks. The National Fire Protection Association requires infrared inspection of electrical systems every six months as part of NFPA 70B compliance guidance, making IRT scanning a documented safety requirement.
In high-runtime production environments, motors, pumps, compressors, and conveyor drive systems also benefit from regular thermal scanning. In HVAC systems, boilers, and steam distribution lines, infrared commonly monitors for energy loss and leaks. Facilities like data centers and UPS systems, where even brief failures can be catastrophic, often use continuous IRT monitoring.


How an Infrared Predictive Maintenance Inspection Works
A reliable infrared inspection starts with the equipment itself. Assets must be operating at normal load levels. Readings on idle or lightly loaded equipment won't reflect real operating conditions and can mask developing faults. With the asset running normally, the thermographer captures thermal images with a calibrated infrared camera under controlled environmental conditions, accounting for factors like ambient temperature, wind, and sun exposure that can otherwise skew a reading.
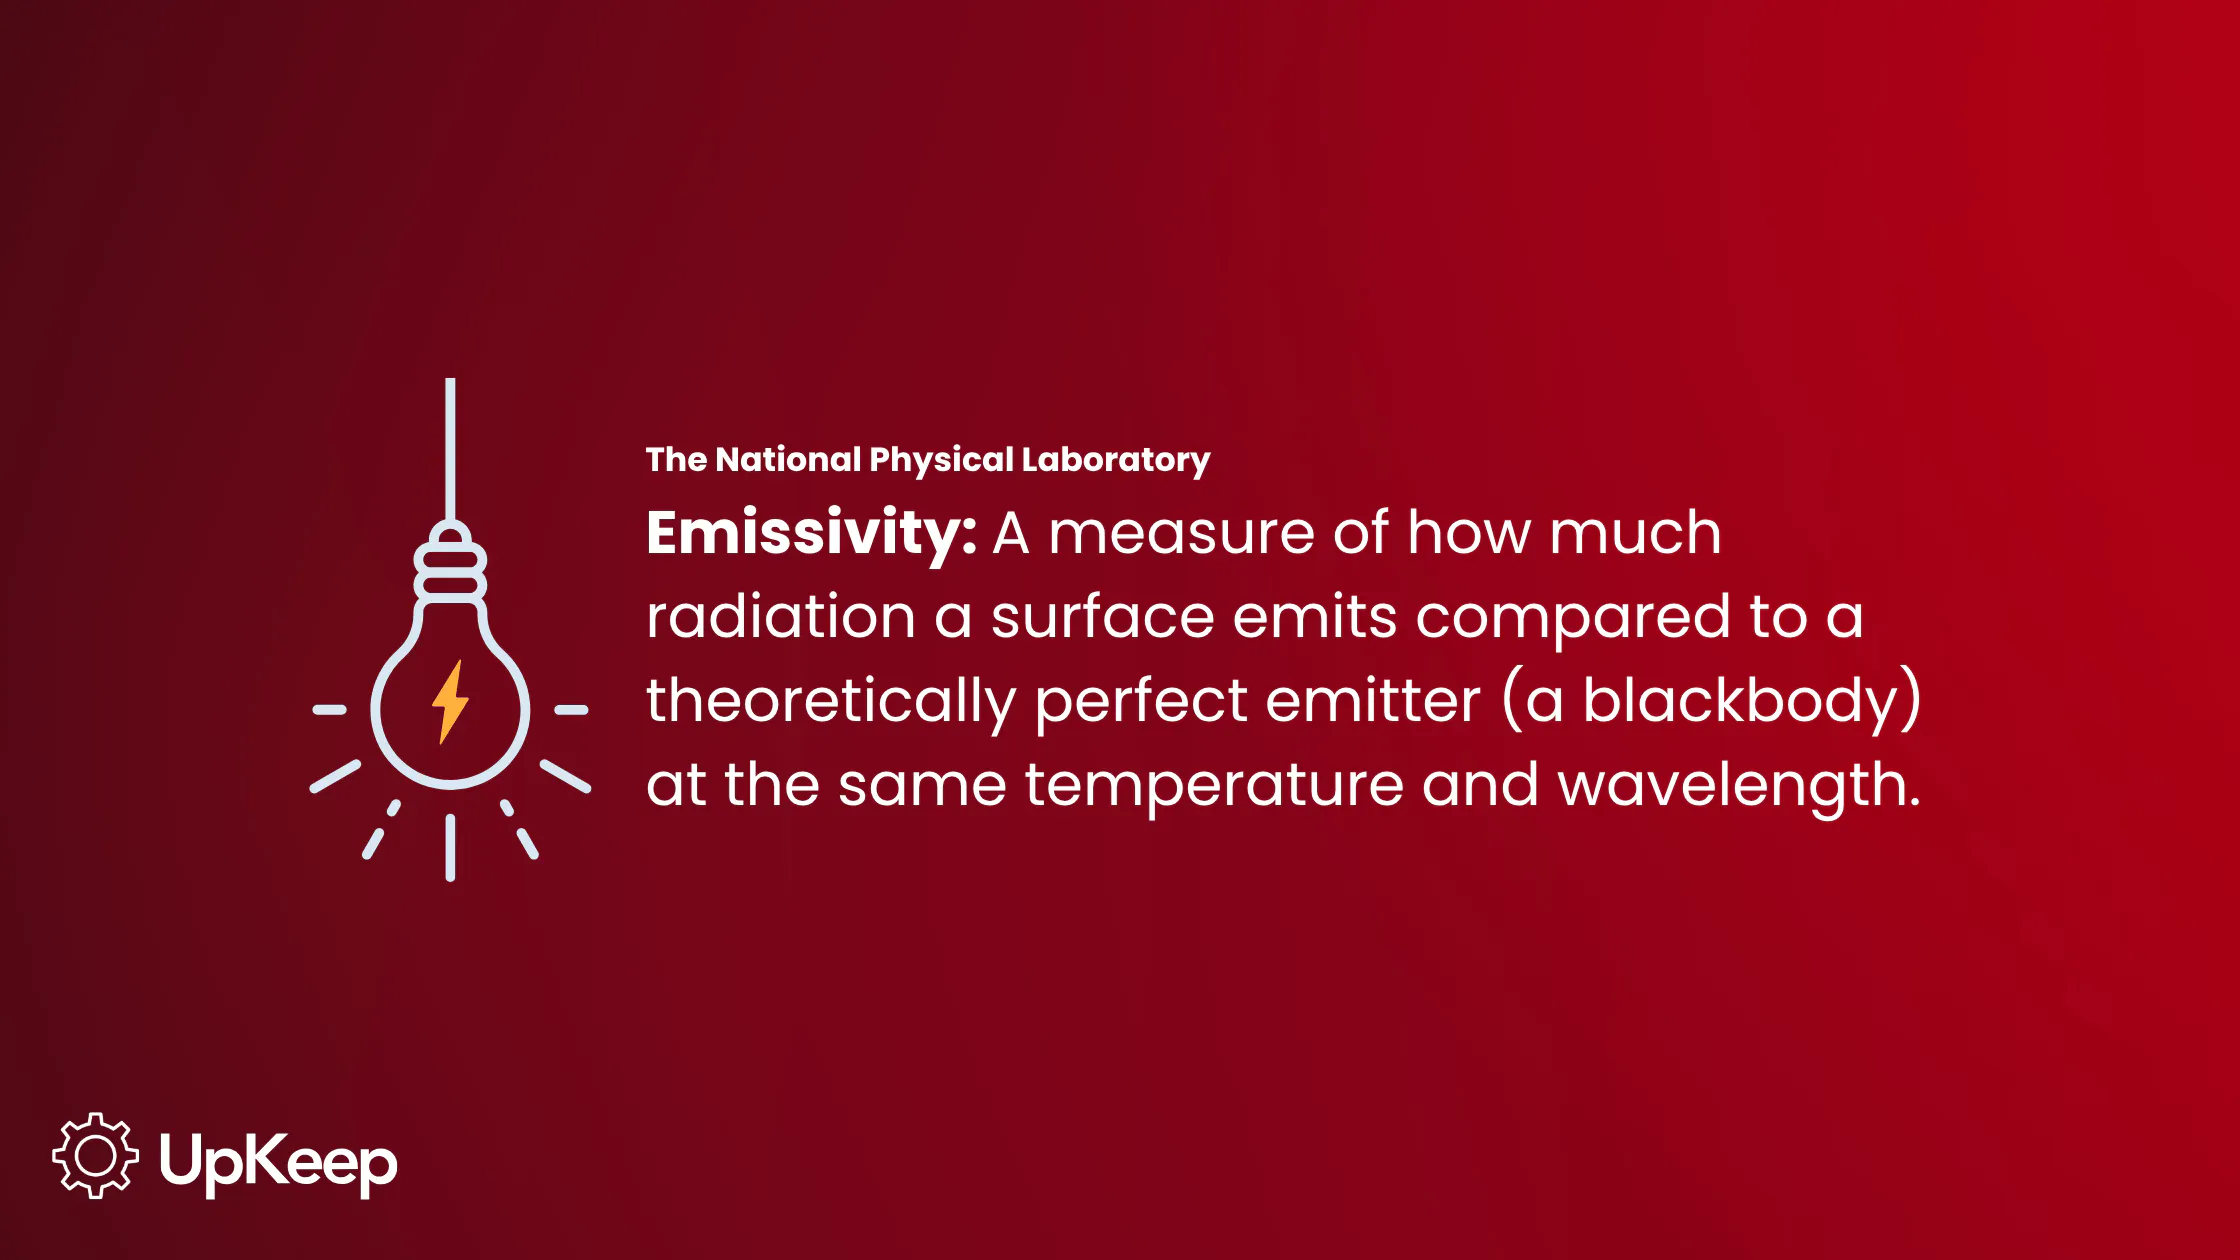
Getting an accurate temperature reading also depends on emissivity, since every material radiates heat differently. Emissivity describes how much radiation a surface emits relative to a perfect theoretical emitter (a "blackbody") at the same temperature and wavelength, and it's shaped by factors like material composition, surface texture, and viewing angle. Thermographers adjust their camera's emissivity setting for each material they scan to make sure the resulting image reflects true surface temperature rather than a distorted reading.

Once thermographers capture the images, they compare them against established baseline readings for that same piece of equipment. A single thermal image without a point of reference tells you far less than a trend over time, so baselines matter as much as the scan itself.
From there, they grade fault severity according to how far the reading deviates from baseline. The severity determines repair priority and how urgently the issue needs to be scheduled. In a connected system, that finding can automatically trigger a work order, with the assigned technician receiving fault photos and a severity grade alongside the assignment, maintaining an active path from detection to repair.
Tools and Equipment for Infrared Predictive Maintenance Programs
The market for this technology continues to grow quickly. The global thermal imaging market is projected to hit $9.6 billion by 2028, reflecting wider adoption across manufacturing, energy, and facilities management.
Below are some of the tools you may rely on across stages of IRT adoption:
Handheld thermal cameras are the most common entry point. Thermographers use these during scheduled walk-around inspections. Resolution can range from entry-level 160x120 sensors up to high-end 640x480 and beyond.
Fixed-mount continuous monitoring cameras permanently install onto high-criticality or hard-to-access assets, streaming real-time thermal data rather than relying on periodic scans.
Thermal analysis and reporting software lets teams annotate, trend, and export findings, turning raw images into actionable reports.
CMMS integration tools connect IRT findings directly to work orders and asset histories, closing the loop between detection and repair. In UpKeep’s CMMS (computerized maintenance management system), this happens automatically, with findings flowing straight into the existing work order and asset record.
For operations not yet ready to invest in dedicated thermal cameras, smartphone-based IRT attachments offer a practical introduction. Field technicians who are already on-site for other inspections can add thermal scanning to their routine without carrying separate equipment, which is often enough to build the business case for a more robust program down the line.
Quantified Cost Savings and Return on Investment
Avoided unplanned downtime is typically the largest source of savings gained from infrared predictive maintenance because unplanned failures cost far more than a planned repair scheduled around production needs.
Targeted, condition-based repairs also reduce labor and parts costs since components aren't swapped out before they actually need to be. Some facilities can also document active infrared inspection programs to qualify for reduced insurance premiums. Energy audits that use infrared often surface insulation gaps and steam losses that, once corrected, reduce utility spend.
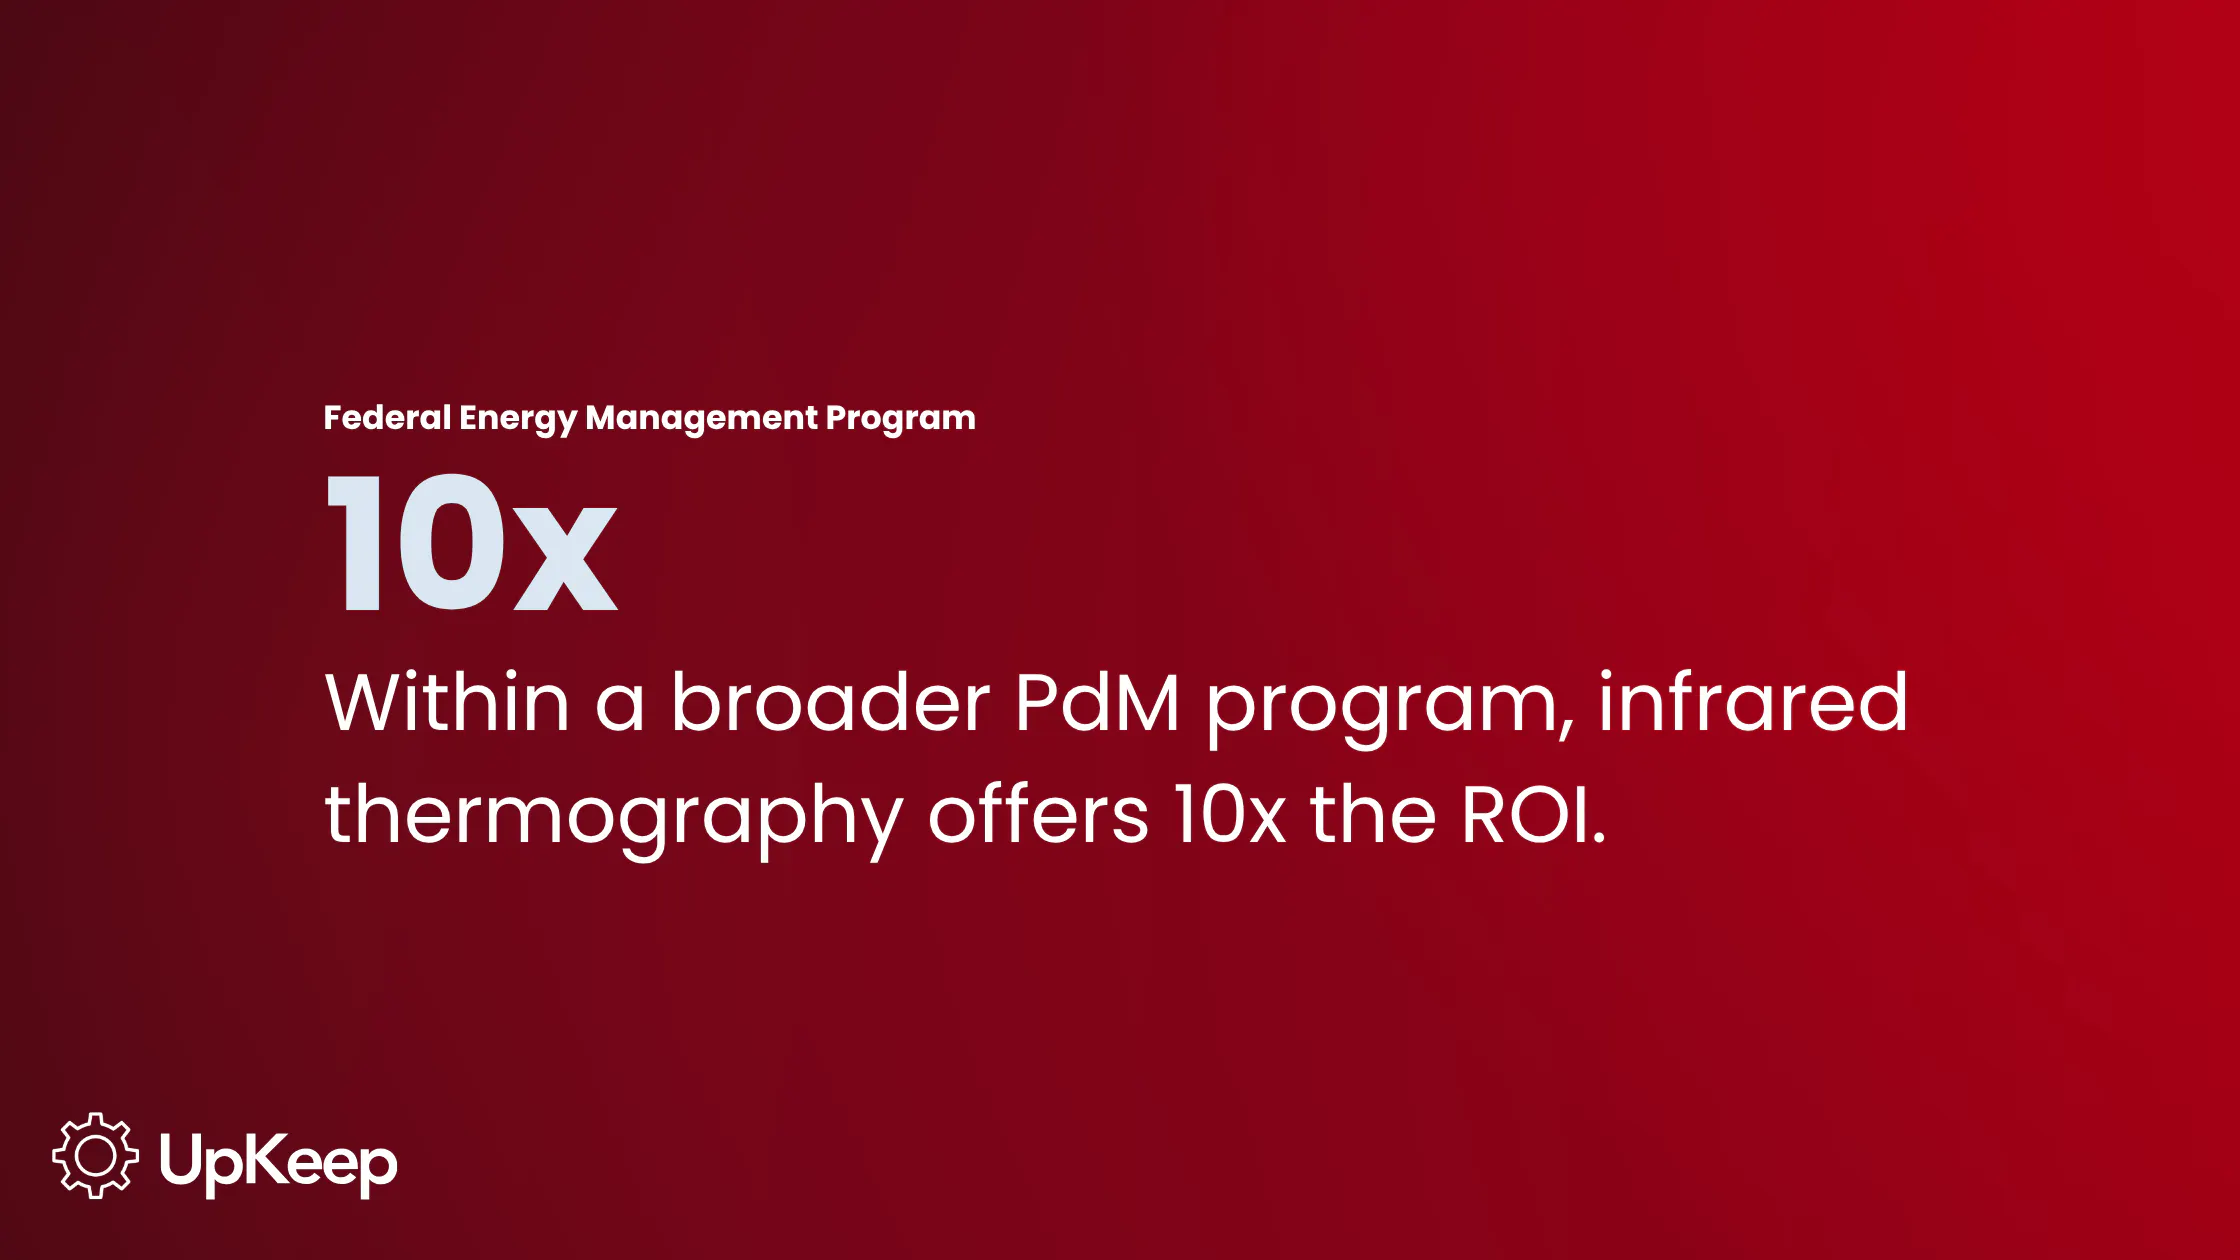
A Federal Energy Management Program (FEMP) study found that applying infrared thermography within a broader PdM program delivered a roughly 10-fold ROI. Predictive maintenance programs themselves have been shown to reduce overall maintenance costs by 25%–30% compared to reactive or purely time-based approaches.

Tracking these gains over time is easier with the right reporting tools. UpKeep's analytics dashboards reveal cost-per-work-order and asset uptime KPIs so teams can quantify their infrared program's ROI rather than relying on anecdotal evidence. This transforms thermal scan data into operational intelligence that informs budget and staffing decisions.
How to Build and Sustain an Infrared Predictive Maintenance Program
Building a program that actually sustains itself requires thorough decisions about scope, baselines, certification, and integration. Here’s how to get started:
Rank assets by criticality and failure consequence. Use this ranking to prioritize your initial inspection scope. For example, a main switchgear panel warrants more attention out of the gate than a low-criticality conveyor.
Establish thermal baselines early. Capture baseline readings during commissioning or during a period of confirmed normal operation, when no faults are present. Later readings are only useful in comparison to a control.
Set inspection frequency by criticality, not the calendar. You might scan a critical transformer quarterly, while a low-risk asset might only need an annual check to satisfy compliance requirements.
Require certified thermographers. Thermographers should hold ITC (or equivalent) Level II certification. It’s harder to defend uncertified readings or use them to justify a repair or capital expenditure.
Integrate IR with other condition-monitoring data. Combining infrared findings with vibration, ultrasound, and oil analysis data produces a much more confident diagnosis than any single method.
Track findings over time to spot patterns. Recurring hotspots on the same asset may point toward a redesign or replacement decision rather than another repair.
With UpKeep, criticality ranking lives directly in asset profiles, inspection schedules can auto-generate as recurring work orders, and findings attach automatically to asset history. Our Nova AI can also flag assets with recurring infrared faults as candidates for proactive replacement.
Putting Infrared and Predictive Maintenance All Together
Infrared for predictive maintenance gives teams a way to see problems developing in electrical, mechanical, and structural assets before they become unplanned downtime. IRT offers a powerful diagnostic layer. When combined with a CMMS that turns findings into work orders and tracks asset history over time, predictive maintenance IRT becomes part of a more efficient, intelligent, and connected operation.
If you're ready to see how infrared findings can flow directly into your maintenance workflow, explore how UpKeep connects inspection data to action. Start your free trial or request a demo.
Frequently Asked Questions About Infrared for Predictive Maintenance
How often should infrared inspections be performed?
Frequency should be based on asset criticality rather than a fixed calendar schedule. Highly critical equipment, such as main electrical switchgear, may be scanned quarterly, while NFPA 70B guidelines recommend infrared inspection of electrical systems at least every six months for general compliance.
What deviation from baseline temperature indicates a problem?
There's no single universal threshold. Severity grade depends on the size of the temperature differential compared to that specific asset's established baseline, and thresholds vary by component type and load conditions. This is why establishing accurate baselines during normal operation is a critical first step.
Can IRT data integrate with a CMMS?
Yes. Infrared findings can be configured to automatically generate work orders in a CMMS like UpKeep, with fault photos and severity grading attached so technicians have full context before starting a repair.
How much does a thermography inspection cost?
Costs vary based on facility size, asset count, and whether the work is done in-house or by a third party. The investment is generally weighed against the cost of unplanned downtime it helps avoid. Studies have found ROI as high as 10 times when IRT is applied within a broader PdM program.
4,000+ COMPANIES RELY ON ASSET OPERATIONS MANAGEMENT
Leading the Way to a Better Future for Maintenance and Reliability
Your asset and equipment data doesn't belong in a silo. UpKeep makes it simple to see where everything stands, all in one place. That means less guesswork and more time to focus on what matters.