Blog Post
What Is Maintenance Inventory and How Should You Track It?
Understanding maintenance inventory management begins with tracking inventory metrics. Read UpKeep's top recommendations.


Maintenance Inventory Systems Explained and 7 Metrics You Should Be Tracking
Inventory can make or break your maintenance performance. Many maintenance metrics and KPIs rely on having the right parts at the right time. While it's important to receive parts immediately, the solution isn't to simply load up the storeroom. On the other hand, proper inventory management is not just getting rid of stock or not stocking altogether.
The right mindset for managing inventory is to optimize—in other words, to stock smartly.
Tracking inventory metrics is the first step toward successful inventory management. By having enough data, one can develop strategies to improve existing processes. Find out what the best maintenance inventory systems include and what metrics you should be tracking for yours.
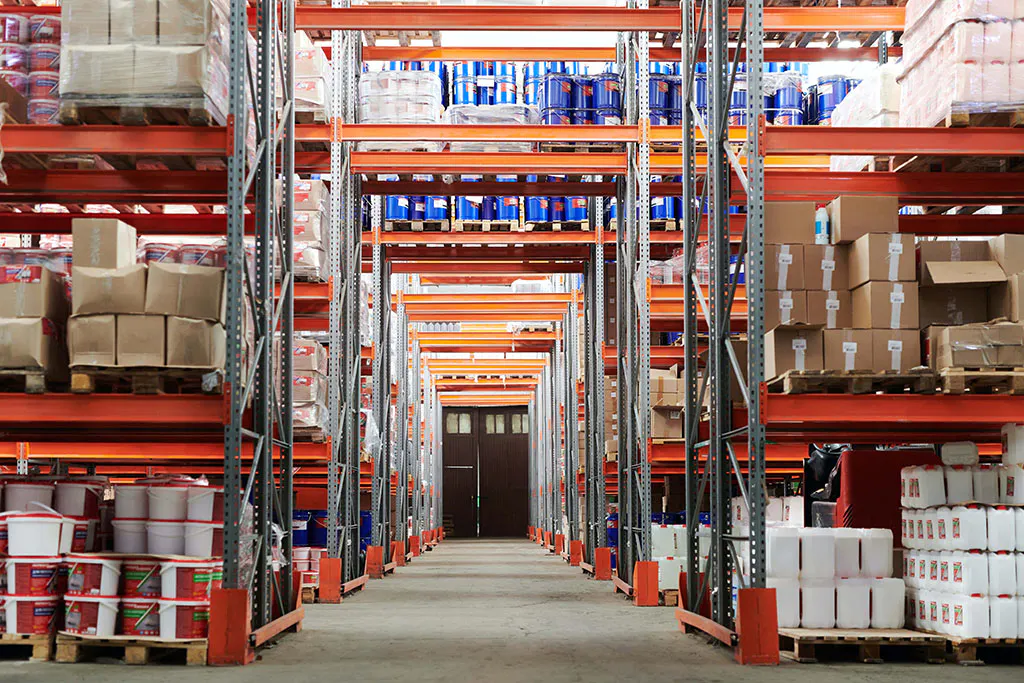
What Is Inventory in Maintenance?
Inventory in maintenance requires using a maintenance inventory system to help organizations manage their stock. In this day and age, a digital system is necessary to make it easier for technicians to find what they need, track inventory levels, and avoid wasteful spending.
The right maintenance inventory management system can:
Track inventory levels and stock
Help locate parts and supplies
Predict stock replenishment timelines
Streamline the inventory purchasing process
Facilitate the supply check-out process
And more
There are several different systems you might use to accomplish this, which we’ve outlined below.
Maintenance Inventory System Examples
MRO Management Software
This platform can help you manage the MRO (Maintenance, Repairs, and Operations) inventory process. Some platforms may offer basic analytics and vendor management, but only as they relate to inventory.
CMMS Software
A CMMS is a computerized maintenance management system that can handle all parts of your maintenance program, including inventory. A CMMS covers the entire maintenance operations process, which means you can use it to easily integrate inventory data with other important components.
EAM Software
EAM (enterprise asset management) software can help you track the entire lifecycle of all your assets. It can track maintenance inventory and turnover, but it also does so much more.
UpKeep has combined the best parts of any maintenance inventory system and combined them into the #1-rated inventory management software. Our mobile inventory management software provides you with powerful insights to better control costs and ensure you have sufficient supply in stock. We’ll help you oversee everything from parts consumption to purchasing and more.
7 Trackable Metrics for Maintenance Inventory
To make informed decisions when optimizing inventory, you need to be equipped with the proper tools. Over the decades, organizations from various industries have established some best practices for inventory management. Here are seven key metrics to track for inventory, as prescribed by the Society for Maintenance and Reliability Professionals (SMRP).
#1: Inventory Turns
Inventory turns describe the ratio of the value of stock purchased to the value of stock currently on hand. The value of the stock purchased is measured over a set period, such as a year. In formula form, this is written as:
Inventory turns = value of stock purchased / value of stock on hand
This metric gives you a sense of how quickly inventory flows through the storeroom. It also indicates the replenishment rate of your stocks. Higher values indicate fast-moving inventory, while lower values suggest slow-moving inventory. Another way to interpret low values for this metric is that materials could be overstocked; you might be bringing in small amounts while still holding massive quantities.
The ideal number of inventory turns not only varies with the type of company or industry but also with the type of stock. For example, expect critical spares to have lower inventory turn ratios since they're not changed out regularly. These critical spares are usually kept on hand in the unlikely event of breakdowns and failure.
Conversely, you would expect to use certain material types regularly. For such materials, like consumables, you want to aim for higher inventory turn ratios to bring in units only as needed. This drives your processes toward more efficient ways of utilizing storage space.
Keeping the nature of this metric in mind, you have to be mindful of setting targets. When considering all types of inventory within your facility, a value of 1 is considered acceptable. When looking at faster-moving materials, or when excluding critical spares, a value of around 3 is recommended. Using this metric in conjunction with other indicators, such as stockouts, can show a broader view of the inventory condition.
#2: Stockouts
Stockouts happen when someone attempts to get a required part from the warehouse and is unable to do so. As a metric, it's expressed as the percentage of requests with stockout over the total number of requests. Best practice targets for stockouts with unplanned work suggest a value of less than 2%. In formula form, stockouts can be written as:
Stockouts (%) = (number of inventory requests with stockout / total number of inventory requests) x 100
Measuring stockouts is a proactive way of increasing overall reliability. It directly affects how quickly maintenance teams can carry out their required activities. However, you must be cautious, your strategies to reduce stockouts also consider inventory optimization. If your plan to reduce stockouts is to fill the warehouse up to its physical capacity, then you might want to think again.
As previously mentioned, stockouts are usually used in conjunction with inventory turns. For example, a low stockout value is generally an indication of good performance. However, low stockouts coupled with low inventory turns can suggest overstocking issues. Having overflowing quantities sitting on the shelf would result in virtually zero stockouts but with unjustifiable costs. Applying an additional layer to stockouts—in this case, inventory turns—provides a more informed assessment of your true inventory performance.
#3: Vendor-Managed Inventory
We can agree that keeping stock in your warehouse costs money, and warehouse logistics is essentially a balancing act. The goal is to stock the right types of inventory that add value while also keeping them at optimal levels. A way of having the parts you need in time, without the burden of managing it yourself, is through vendor-managed inventory.
As a metric, vendor-managed inventory is defined as the number of vendor-managed stocked materials divided by the total number of stocked materials. The basis for counting each material is by individual stock-keeping unit (SKU). In formula form, this can be shown as:
Vendor-managed inventory (%) = (number of vendor-managed stocked materials / total number of stocked materials) x 100
Alternatively, the basis for calculating the vendor-managed inventory percentage can also be the actual value of the stocked units. This accounts for the stocked inventory worth, rather than the number of SKUs. In this case, the formula becomes:
Vendor-managed inventory (%) = (value of vendor-managed stocked materials / total value of stocked material) x 100
There are some notable benefits of having your suppliers take full responsibility for your inventory needs. You not only gain accurate visibility with lead times, but it also places orders in optimal quantities and frequencies.
Choosing the right materials to be managed by suppliers is an opportunity to streamline stocking levels. Important notes to remember with this kind of setup are to ensure clear communication with your suppliers and provide accurate usage forecasts.
#4: Inactive Stock
Inactive stock includes materials in your stockroom that have not been used in the last 12 months or longer. Analyzing the number of inactive stocks can lead you to more strategic decisions and actions to manage your working capital.
For instance, you might want to review your stocking levels for identified inactive materials or even write off some of the units on hand.
The list of inactive stock records should exclude critical spares and non-stock materials.
Critical spares are kept in stock because of their importance in keeping operations running in the event of unexpected downtime. They're usually high-value equipment with relatively long lead times.
Non-stock materials are items on the inventory records but not physically stocked.
You can easily keep track of these categories when using a CMMS that distinguishes one from the other.
The inactive stocks metric is calculated as the percentage of inactive inventory records of the total number of inventory records. This excludes critical spares and non-stock materials. In this calculation, think of each inventory record as equivalent to a unique SKU. In formula form, it’s:
Inactive stock records (%) = {[number of inactive inventory stock records – (critical spares records + non-stock records)] / [total number of inventory stock records – (critical spares records + non-stock records)]} x 100
Inactive stock can also be computed based on inventory value instead of the number of records. The following formula shows this scenario:
Inactive stock value (%) = [(inactive inventory stock value – critical spares stock value) / (total inventory stock value – critical spares stock value)] x 100
Using the percentage based on the number of records displays the extent of the issue, while the stock value shows your working capital reduction potential. Using both of these can tell you which stock categories you can prioritize to get the most cost reduction for the least amount of effort.
#5: Storeroom Transactions
Storeroom attendants, also referred to as storeroom clerks, typically take on a variety of duties as part of their day-to-day activities. These duties include:
Issuing parts
Organizing stocks
Making preparations to ship or receive materials
Performing inventory counts
General housekeeping.
Counting the number of transactions in a given period approximates the amount of work performed by these employees.
Calculate this metric by taking the total number of transactions within a period, and then dividing it by the number of clerks. Another interpretation of this calculation is that it represents the average number of transactions each clerk performs within the period. The following formula expresses the calculation of this metric:
Storeroom transactions = total number of storeroom transactions / total number of storeroom clerks
Before calculating this metric, it's important to define the kinds of transactions performed in the storeroom. This way, you're ensuring all types of activities are accounted for. Transactions should include:
Goods issues
Returns
Cycle counting
Receipts
Adjustments
And more
Utilizing existing inventory management software will help keep track of these movements.
Another important aspect of this metric is qualifying the people who are considered storeroom clerks. Each assigned storeroom clerk should be a dedicated full-time equivalent in the assigned role while performing these calculations. Without specific assignments, the data output would not be representative of the actual transactions each employee performs.
Best practice values for storeroom transaction counts can vary widely depending on the facility and the industry to which it belongs. This metric can be useful when scaling up within the same modes of operation, especially when used with other service or delivery metrics.
#6: Storeroom Records
Similar to storeroom transactions, storeroom records also evaluate the workload of storeroom staff. You can assume the tasks an employee would have to do increases with the number of materials they'll be managing. The number of individual SKUs on record, in this case, represents the number of managed materials.
You can calculate this metric by taking the total number of stock records and dividing it by the number of clerks working full-time within a given period. This roughly estimates the average number of records each working employee would need to take charge of. In formula form, it’s:
Storeroom records = total number of inventory stock records / total number of storeroom clerks
The total number of inventory stock records would include any material with a unique SKU. This means non-stock materials, critical spares, and inactive stock as well. Only materials not cataloged by the facility would be excluded from this count. Examples of uncataloged materials are low-value, free-issue materials typically issued without a goods issue transaction.
As with storeroom transactions, best practice targets for storeroom records will be different for each facility. It also proves to be a useful tool for gauging workforce additions given a surge in newly created material records. It can be a helpful benchmark between similar facilities with comparable working procedures.
#7: Maintenance Material Costs
Implementing a comprehensive maintenance strategy requires a lot of resources and could pile up to a substantial total cost. A sizable portion of the total maintenance costs would be allocated to material costs. Maintenance material costs could include any expense incurred for materials, supplies, and consumables required to perform maintenance activities within a given period.
Almost all maintenance, repair, and operations (MRO) materials would have maintenance material costs. This includes all:
Stocked parts
Non-stock materials
Supplies
Consumables
Expenses to repair spare components
By definition, maintenance material costs exclude materials acquired for plant expansions and improvements; these are no longer in the maintenance program scope.
There are numerous other cost sources when looking at the entire maintenance strategy. Most of these other sources come from labor and service expenses. Other pieces of the maintenance budget include internal maintenance labor, maintenance staff salaries and wages, contractor services, and janitorial services. All these, plus the material maintenance cost, would sum up the total maintenance cost.
Through this metric, maintenance material costs are expressed as a percentage of the sum of all maintenance costs. The time basis for the metric is usually in months, quarters, or years. The following formula shows this calculation:
Maintenance material cost (%) = (maintenance material cost / total maintenance cost) x 100
As a supplementary analysis, maintenance material costs can be compared to maintenance labor costs. High percentages of material costs may suggest your preventive or predictive strategies are not as effective as expected. High labor costs, on the other hand, might suggest ineffective planning. When comparing similar facilities, these percentages may be used as benchmark values to compare best practices.
Make Tracking Your First Step With Mobile-First Software From UpKeep
As the old saying goes, you can’t improve what you can’t measure. Tracking inventory metrics is the first step toward successful inventory management.
By having enough data on the current situation, one can develop strategies to improve existing processes. After implementing the improvements, the metrics would objectively show the things you did correctly and the things you can further refine. This becomes a continually evolving process of learning and development.
UpKeep is the #1 CMMS used by Maintenance and Reliability teams. Its Enterprise Asset Management solutions can help you easily keep track of maintenance inventory and so much more. Contact us today to request a demo or start a free trial.
Want to keep reading?


Article
MRO Storeroom Best Practices


Article
Maintenance Procurement | 7 Ways to Avoid Costly Mistakes


Article
How to Use eBay to Save Money and Time on Procurement
4,000+ COMPANIES RELY ON ASSET OPERATIONS MANAGEMENT
Leading the Way to a Better Future for Maintenance and Reliability
Your asset and equipment data doesn't belong in a silo. UpKeep makes it simple to see where everything stands, all in one place. That means less guesswork and more time to focus on what matters.