Entrada en el Blog
UpKeep Update: UpKeep Analytics
UpKeep Analytics is a reporting engine that will allow you to make more data-informed decisions and better financially forecast for your maintenance team.


What is UpKeep Analytics?
We are so excited to share with you a brand new feature that is going to be so transformative for so many maintenance teams. Introducing… UpKeep Analytics!!
UpKeep Analytics is a powerful tool that will provide you with the ability to report on any data point entered into UpKeep. These reports will not only allow you to make more data-informed decisions, but also better financially forecast for your organization.
Why did we launch UpKeep Analytics?
Customers were asking us for more ways to analyze data. We heard from so many of our customers and what they would like to do with more data and we wanted to help provide that value. After many insightful conversations with our customers, we partnered with Looker and launched a huge initiative for big things in UpKeep.


What you’ll be able to do with UpKeep Analytics
Business Plus and Enterprise Users can get even more from their data in UpKeep.
Reduce costs and time spent on work orders.
You can view hours spent and time remaining and then filter data by total costs, average hours, and by compliance. This information will allow you to better financially forecast for your organization.
Achieve the full useful life of your assets and generate savings.
Determine the root cause of breakdowns before they start costing you. Drill-down on the data that matters, including:
Total maintenance costs
Mean-time between failures
Downtime analysis
And more!
Provide and report intuitive data to management.
You will be able to learn the meaning behind your metrics with specific filters and scheduled alerts. You can share the entire history of your data with upper management via CSV or PDF.
Prevent unnecessary expenses.
Know exactly what is in your inventory and how frequently you’ll need to replenish your parts storage.
Companies often lose a lot of money with over-ordering inventory or under-ordering. Money is being wasted if too much inventory is sitting on the shelf. If you don’t have enough parts, that can increase downtime to weeks, or even hours, which can cost tons over time. Columbia Fruit before investing in UpKeep had no way of tracking spare parts and would order more than they needed, costing thousands in overhead costs. UpKeep Analytics will pay for itself – to prevent things like over-ordering parts.
Core Features of UpKeep Analytics
With UpKeep Analytics, you can get advanced insights on:
Work Orders
Assets
Meters
Parts
Requests
Users
And, if you upgrade to Enterprise, you can receive customized reports.
Work Orders Reports
Make smarter resource allocation decisions when planning work orders. Within work orders, you can now see a range of reports including:
Status Reports
Work Order Analysis
Maintenance Compliance
Work Order Trends
Work Order Aging
Time and Cost
and more!
Here are a few things you can expect from your work order reports in UpKeep Analytics.
Status Report
A high-level view of what you are doing today, including what workers have been completed and how much work orders are remaining per technician.


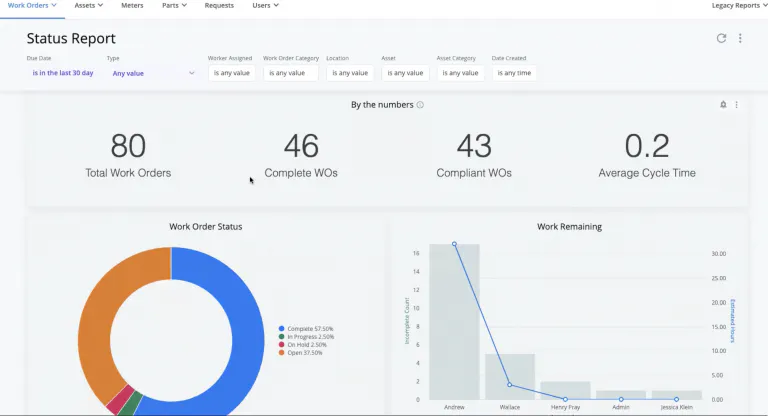
When you hover your mouse over the charts, you can even more fine-print data! Of those 80 total work orders listed here, there are 10 work orders that are medium priority. You can click on the medium work orders and see all the work orders listed. Let’s say you have an unexpected failure on a conveyor that was marked as a compliant work order. You can go back and see exactly what procedures were performed on the conveyor and when actions were taken to diagnose the root cause of the issue. You can hover your mouse over each technician and see how many estimated hours of work they have based on the number of assigned work orders. This lets maintenance managers better plan our work schedules based on data.
Work Order Analysis


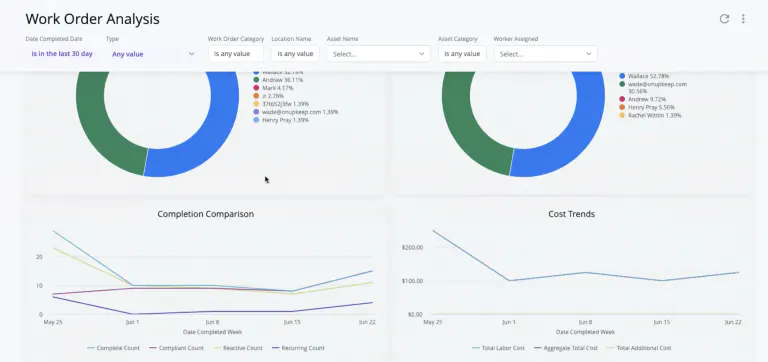
The work order analysis report lets you see how many work orders were completed and the person responsible. It also shows you how many work orders are reactive or preventive, as well as any costs incurred with the different types of work orders over time.
Maintenance Compliance


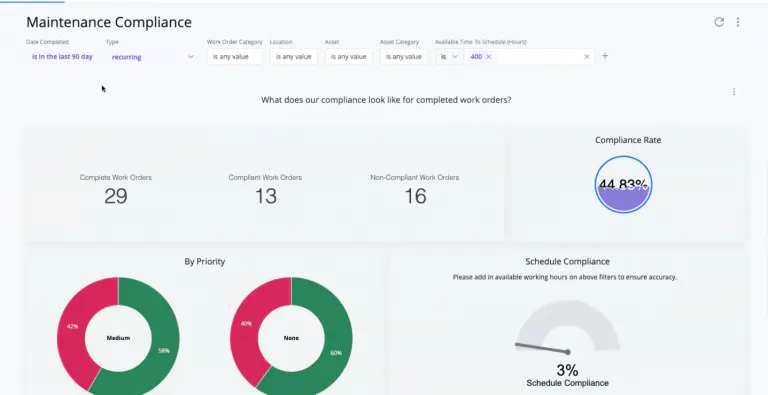
The maintenance compliance report will show you the percentage of preventive maintenance activities that have been completed on schedule. You can filter maintenance compliance by priority, by location, and more. These filters could show patterns of where and where non-compliant work orders are taking place, or on what equipment.
Status report filters can help managers collect even more targeted datapoints that can help managers prioritize workloads and communicate with requesters the status of work orders based on location, asset, category, and date created.
For example, one of our customers who works in a bottle manufacturing facility will be using this report to see how many of their assets are meeting maintenance compliance KPIs. This will let you better plan and schedule for technicians, as well as make data-driven decisions to reduce the volume of non-compliant work orders.
Assets Report
The assets report will let you understand breakdowns more clearly and make changes quicker. Overall, you will be able to achieve the full useful life of your assets. With asset reporting in UpKeep analytics, the costs of maintenance on your assets are no longer a mystery. Everything is all in one place - total maintenance cost, mean time between failures, downtime analysis, and more. More data will get you to the root cause of breakdowns before they start costing you.
Within assets, you can now see a range of reports including:
Reliability dashboard
Total maintenance cost
Useful life
Asset check-out
and much more!
Here are just a few reports you’ll learn about your assets.
Reliability Dashboard


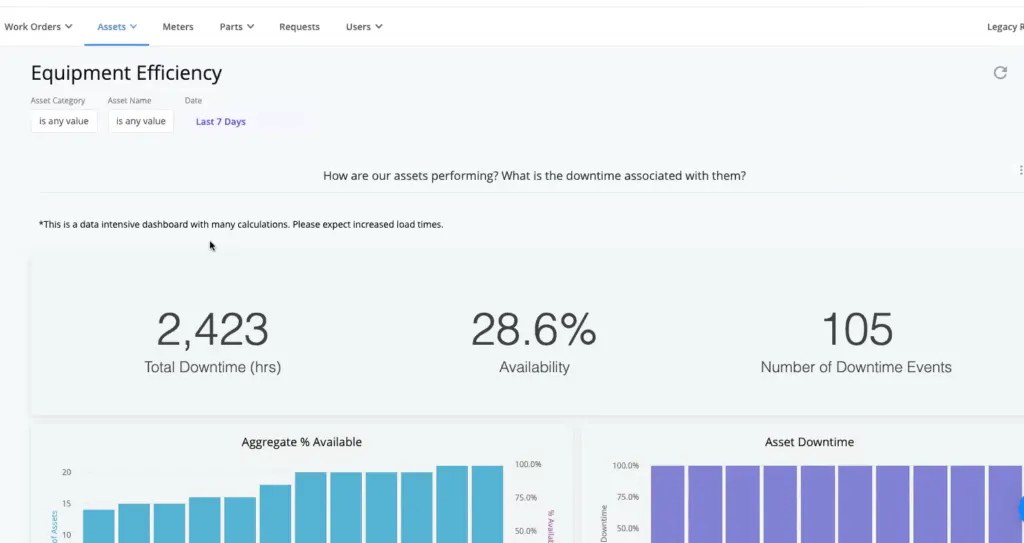
Within the equipment efficiency report, you can see how your assets are performing and downtime associated with it. You will see the total asset downtime, percentage of availability, and the number of downtime events. Additionally, you can see your top ten assets and what percentage of time they experienced unplanned downtime.


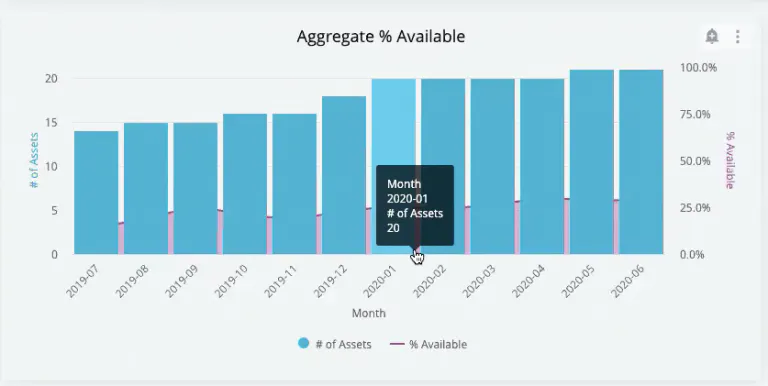
With narrow filtering options, you can see a comprehensive view on what type of category of asset experiences the most downtime. The aggregate percentage available chart shows you the percentage of availability on your top assets.
Repair Window
The repair window dashboard shows you on average how long your equipment is running and how long it takes to fix equipment during downtime. It shows you the overall mean time between failures, the meantime to repair, and the mean time between maintenance for 90 days.


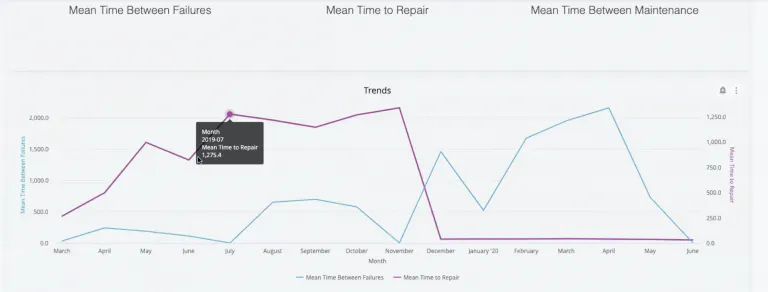
UpKeep Analytics lets you see exactly what months of the year you are hitting your targeted goals for equipment efficiency. You can also drill-down exactly on the pieces of equipment that are requiring longer repair times than others. This information lets maintenance managers forecast future planning. Ideally, mean time between failure will be higher than the mean time to repair.
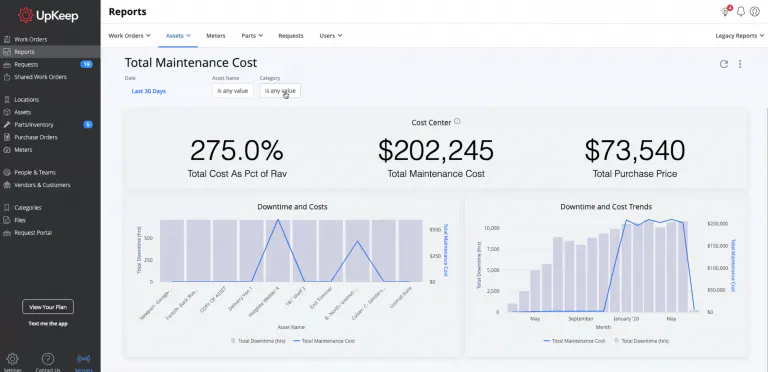
Total Maintenance Cost
Total maintenance cost lets you see how much you are spending on maintenance overall. At a quick glance, you see total maintenance cost as a percentage of Rav, total maintenance cost, and total purchase cost. This can highlight all of the savings you are earning from preventive maintenance, as well as any costs incurred from downtime.
Our filters let you narrow in on the downtime costs for high-value assets and get to the root cause analysis.
Meters Report
Our meters report includes a Meters Analysis that is fully exportable! With the meters report you can:
Predict maintenance schedules more precisely.
Allocate time for your team members with more accuracy.
Set more precise automated work orders with meter analysis.


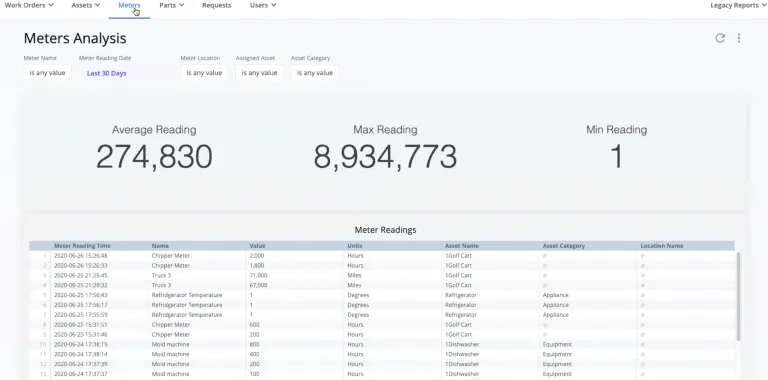
Now, you can have the ability to do a full export of meter readings. You can narrow it down by specific meter reading timeframes or by locations.
Time and resource planning becomes easier when you know when assets will require work orders in the future.
Parts Report
UpKeep Analytics will show you how to prevent unnecessary expenses on excess spare parts. Know exactly what is in your inventory and how frequently you replenish your parts storage. More trust restored and less guesswork when spending on critical spares.
Our parts reports include:
Parts Consumption
PM Inventory Check
Requests Report
Get a clearer picture of maintenance request timelines, from start to finish. See who is the most frequent requester and what are the most common types of requests are made by individuals.
Users Report
The Users report will let you do even more with tracking time and cost associated with your technicians. The following reports in the Users tab include:
User Login
Itemized Time Report


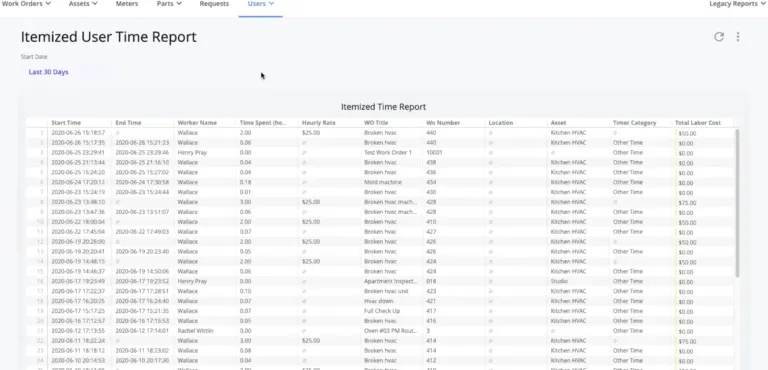
The itemized user time report is a breakdown of all the time entries across work orders. You can see the hourly rate and the total labor cost associated with each work order.
Custom Reporting
You can take ANY of the metrics inside of UpKeep and any visualization you’d like and we can create a specialized report for you and your team. The KPIs that matter most to your team can be front and center. Take your analytics to the next level by setting up customized dashboards.
Achieve world-class industry results
Explore brand new dashboards with world-class industry benchmarks and see where your team compares
See the information that matters
Configurable layouts give you the metrics you care about, front and center.
Report on customized categories
See patterns beyond recurring preventive maintenance work orders with customized category reports.


¿Quieres seguir leyendo?


Artículo
UpKeep es una de las principales empresas de 2022 de Y Combinator


Artículo
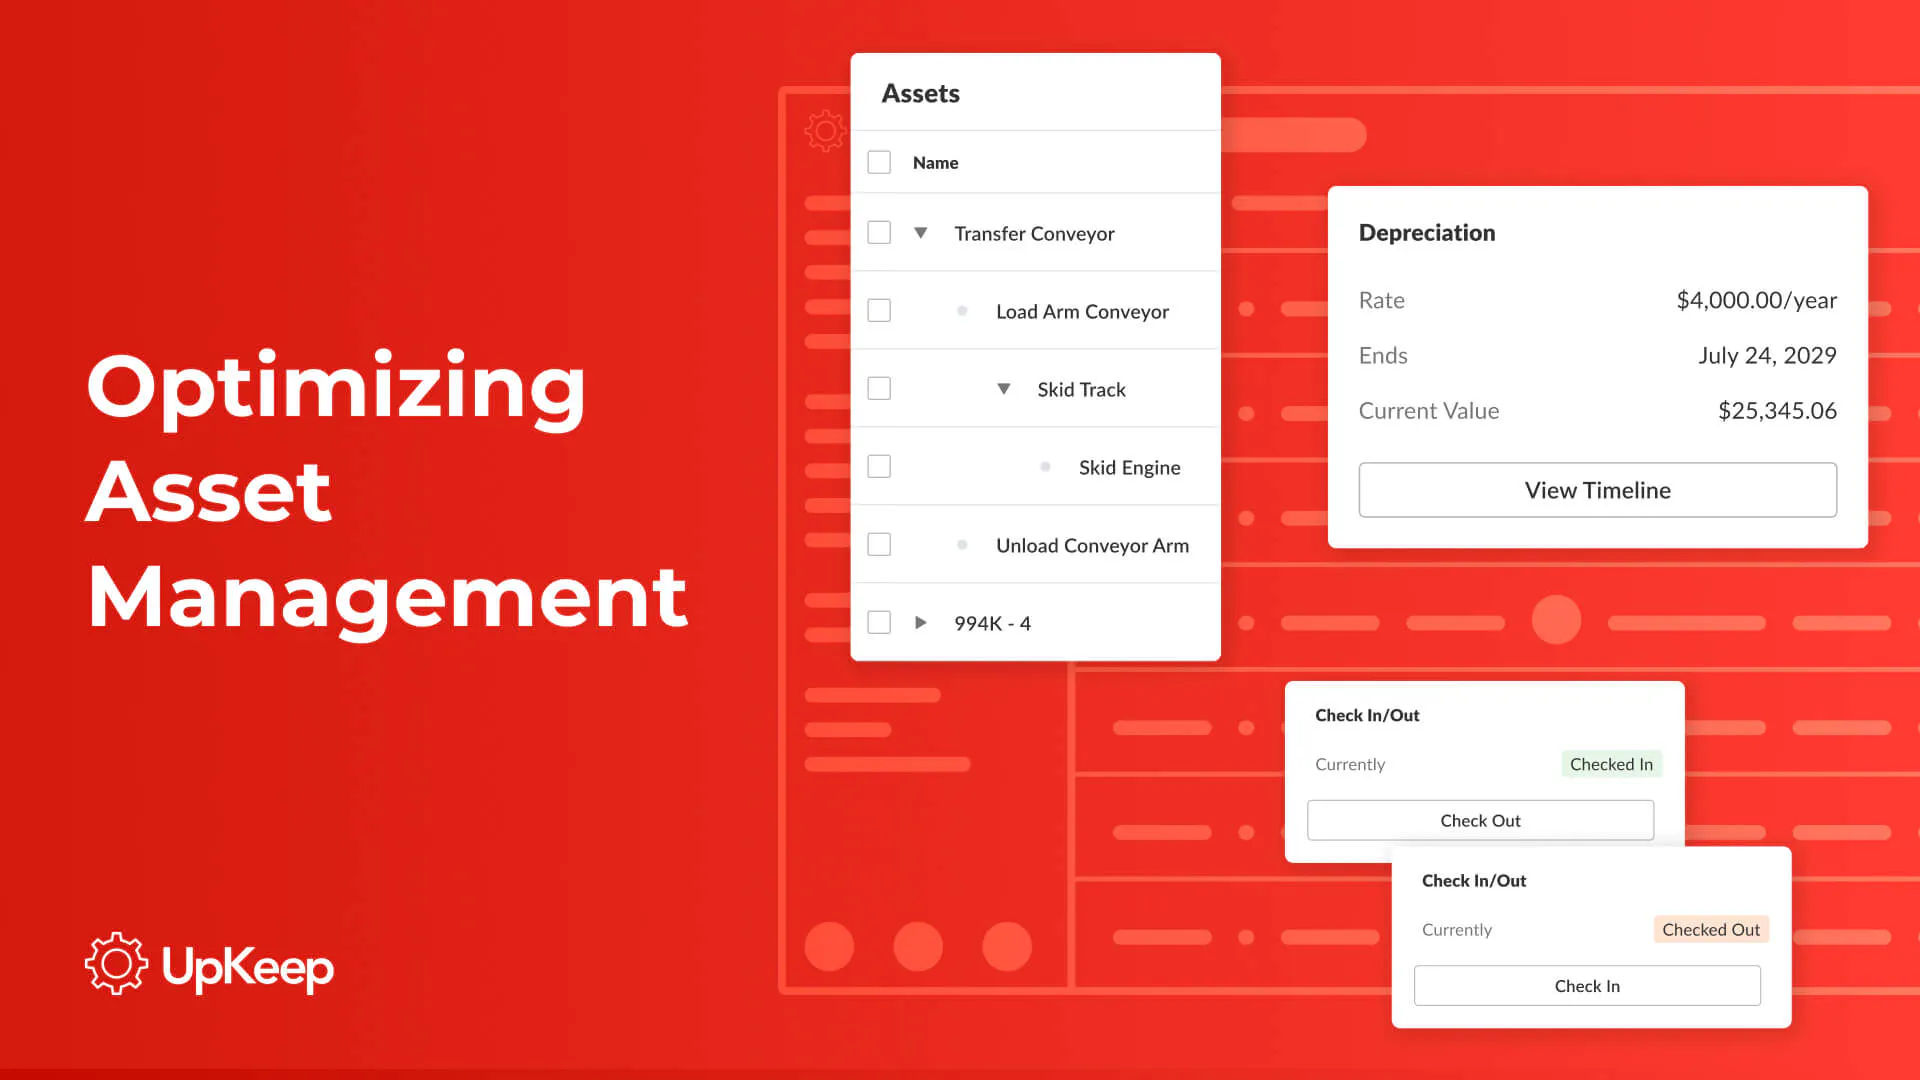
Optimice la gestión de activos con la solución EAM de UpKeep

Artículo
Resumen del año de reconocimiento de UpKeep 2021
MÁS DE 4000 EMPRESAS CONFÍAN EN LA GESTIÓN DE OPERACIONES DE ACTIVOS
Liderando el camino hacia un futuro mejor para el mantenimiento y la confiabilidad
Los datos de sus activos y equipos no pertenecen a un silo. UpKeep simplifica ver dónde se encuentra todo, todo en un solo lugar. Eso significa menos conjeturas y más tiempo para concentrarse en lo que importa.