Blog Post
How Maintenance Will Revolutionize the World (Chapter 4, Part 2)
Failure Mode and Effects Analysis (FMEA) is a helpful tool to recognize and evaluate failures and prevent the potential failure from occurring.
*Over the next few weeks, UpKeep will be releasing chapters from our upcoming publication, How Maintenance Will Revolutionize the World. Chapter 4.1 can be found here.
PHASE 2 - MAINTENANCE VS RELIABILITY


STEP 1 - Understand failure modes
Failure Mode and Effects Analysis (FMEA) is a helpful tool to: (a) recognize and evaluate the potential failure(s) of an item or process and the effects of that failure, and (b) identify actions that could eliminate or reduce the likelihood of the potential failure occurring (probability of occurrence).
The performance of an asset relates to its current ability to meet current and future demands. Assets can fail in four major ways, known as primary failure modes, which can be used to determine the most appropriate investment strategies relevant to the asset.
The four Primary Failure Modes are: Physical Mortality, Level of Service, Capacity, and Financial Efficiency.
We have included a step-by-step process below to begin assigning failure modes to your assets and make a prioritized plan as an organization. With each example, a template has been provided at the end of that step for you to follow along.
STEP 2 - Organize your assets and brainstorm failure modes in the template provided.
Think of anything that can go wrong and use the chart below of examples to help you.
EXAMPLE:
| Failure Mode | Description and Drivers | Assessment Technique | Management Strategy |
| Physical Mortality | Asset deterioration reduces performance below an acceptable level Age, Usage, Operational Stresses, Acts of Nature | Condition Level 1 – Staff Knowledge – Desktop ‘Delphi’ Level 2 – Intermediate level Physical Inspection (See Appendix A) Level 3 – Advanced Physical Testing and inspection | Renewal, O&M Optimization |
| Capacity | Demand exceeds design capacity Growth and System Expansion | Capacity Level 1 – Staff Knowledge – Desktop ‘Delphi’ Level 2 – Desktop Capacity Modeling Level 3 – Capacity Modeling with Field Data | Redesign |
| Level of Service | Functional and Reliability requirements exceed design capability
| Regulations, Quality, Safety, Service, Noise, Odor Function Level 1 – Staff Knowledge – Desktop ‘Delphi’ Level 2 – Process Assessment Level 3 – Strategic Planning Reliability Level 1 – Staff Knowledge – Desktop ‘Delphi’ Level 2 – Desktop Analysis Level 3 – Work Order History (MTBF) | Redesign, O&M Optimization |
| Financial Efficiency | Cost of Operation exceeds feasible alternatives New Technology, Wear, Spare Parts | Efficiency Level 1 – Staff Knowledge – Desktop ‘Delphi’ Level 2 – Desktop LCCA (Estimated Data) Level 3 – LCCA with Field Data | Replace |
TEMPLATE:
| Asset Name | Possible Failure Modes |
| |
| |
|
STEP 3 - Rate the likelihood of occurrence of each failure mode based on the below rubric.
Add your rating to your template.
EXAMPLE:


| Likelihood of Occurrence | Criteria: Possible Failure Rates/Probability of Failure | Rating |
| Extremely High | Failure rate of less than 5 FPMH/Probability of Failure During Mission <0.2 | 10 |
| Very High | Failure rate of less than 2 FPMH/Probability of Failure During | 9 |
| High | Failure rate of less than 1 FPMH/Probability of Failure During Mission <0.05 | 8 |
| Moderately High | Failure rate of less than 200 FIT/Probability of Failure During Mission <0.01 | 7 |
| Moderate | Failure rate of less than 100 FIT/Probability of Failure During Mission <0.005 | 6 |
| Moderately Low | Failure rate of less than 20 FIT/Probability of Failure During Mission <0.001 | 5 |
| Low | Failure rate of less than 10 FIT/Probability of Failure During Mission <0.0005 | 4 |
| Very Low | Failure rate of less than 2 FIT/Probability of Failure During Mission <0.0001 | 3 |
| Extremely Low | Failure rate of less than 1 FIT/Probability of Failure During Mission <0.00005 | 2 |
| Remote | Failure rate of less than 0.2 FIT/Probability of Failure During Mission <0.00001 | 1 |
TEMPLATE:
| Asset Name | Possible Failure Modes | Likelihood |
| ||
| ||
|
STEP 4 - Rate the severity of each failure mode for your assets using the below rubric as a guide.
Add your severity rating to your template.
[Image not migrated]
EXAMPLE:
Severity | Criteria | Rating |
Extremely High | Catastrophic: Serious injury or loss of life. | 10 |
Very High | 9 | |
High | 8 | |
Moderately High | 7 | |
Moderate | 6 | |
Moderately Low | 5 | |
Low | 4 | |
Very Low | 3 | |
Extremely Low | 2 | |
Remote | Minor: No loss of downtime. | 1 |
TEMPLATE:
Asset Name | Possible Failure Modes | Likelihood | Severity |
| |||
| |||
|
STEP 5 - Assign a priority number to each asset.
To do this, multiple your severity rating x your likelihood of occurrence rating. Here, you can see how our example results in clear priority numbers. Add your priority numbers in your template.


EXAMPLE:
Asset Name | Asset Category | Primary Failure mode | Likelihood of occurrence | Severity | Risk Priority Number (Severity * Occurrence) |
HVAC - Air Filtration | HVAC | Outside air filtration blockage. (normal & abnormal events) | 3 | 6 | 18 |
HVAC - Air Filtration | HVAC | 10 | 7 | 70 |
Template:
| Asset Name | Possible Failure Modes | Likelihood | Severity | Risk Priority Number (Severity * Occurrence) |
| ||||
| ||||
|
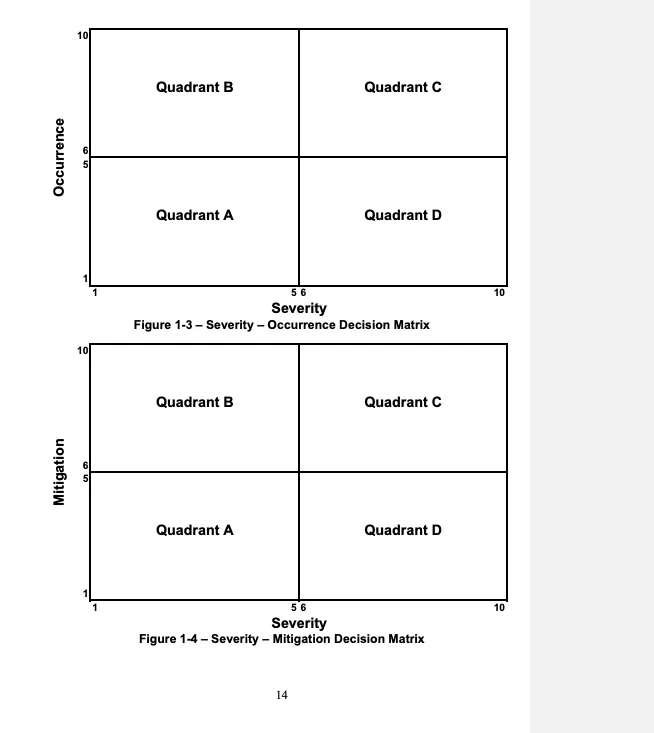
STEP 6 - Understand mitigation by risk priority.
Reorganize your template so that you are now viewing your assets from most important to least. Now, brainstorm a plan of actions or mitigations you can take to avoid failure in the first place.
EXAMPLE:
Asset Name | Asset Category | Primary Failure mode | Severity | Likelihood of occurrence | Risk Priority Number (Severity * Occurrence) | Mitigation / Action Plan |
HVAC - Air Filtration | HVAC | Outside air filtration blockage. (normal & abnormal events) | 6 due to bio containment | 3 | 18 | Duplicate outside air filtration Predictive fouling rate |
HVAC - Air Filtration | HVAC | Fan failure | 9 due to loss of control of critical parameters. Loss of pressure | 6 | 54 | Standby fans Vibration monitor |
TEMPLATE:
Asset Name | Possible Failure Modes | Likelihood | Severity | Risk Priority Number (Severity * Occurrence) |
| ||||
| ||||
|
STEP 7 - Revisit your plan every Quarter.
4,000+ COMPANIES RELY ON ASSET OPERATIONS MANAGEMENT
Leading the Way to a Better Future for Maintenance and Reliability
Your asset and equipment data doesn't belong in a silo. UpKeep makes it simple to see where everything stands, all in one place. That means less guesswork and more time to focus on what matters.