Blog Post
Fleet Maintenance Report: What to Track, How to Build One, and What the Data Should Drive
A fleet maintenance report tracks costs, downtime, and PM compliance per vehicle — here's what to include, how to build one, and when to automate it.


Key Takeaways
A fleet maintenance report converts raw work order and inspection data into per-vehicle metrics, including cost per mile, uptime percentage, and PM compliance rate. Data is organized so vehicles that consume a disproportionate amount of the budget are immediately singled out.
A declining PM completion rate is an early warning sign, and the report delivers it in time to act. When scheduled service falls behind, the report surfaces it as a falling ratio before it turns into emergency work orders.
Repair-versus-replace decisions require a full per-vehicle cost history in a single, summarized view. Without it, replacement timing defaults to gut feeling on mileage and age.
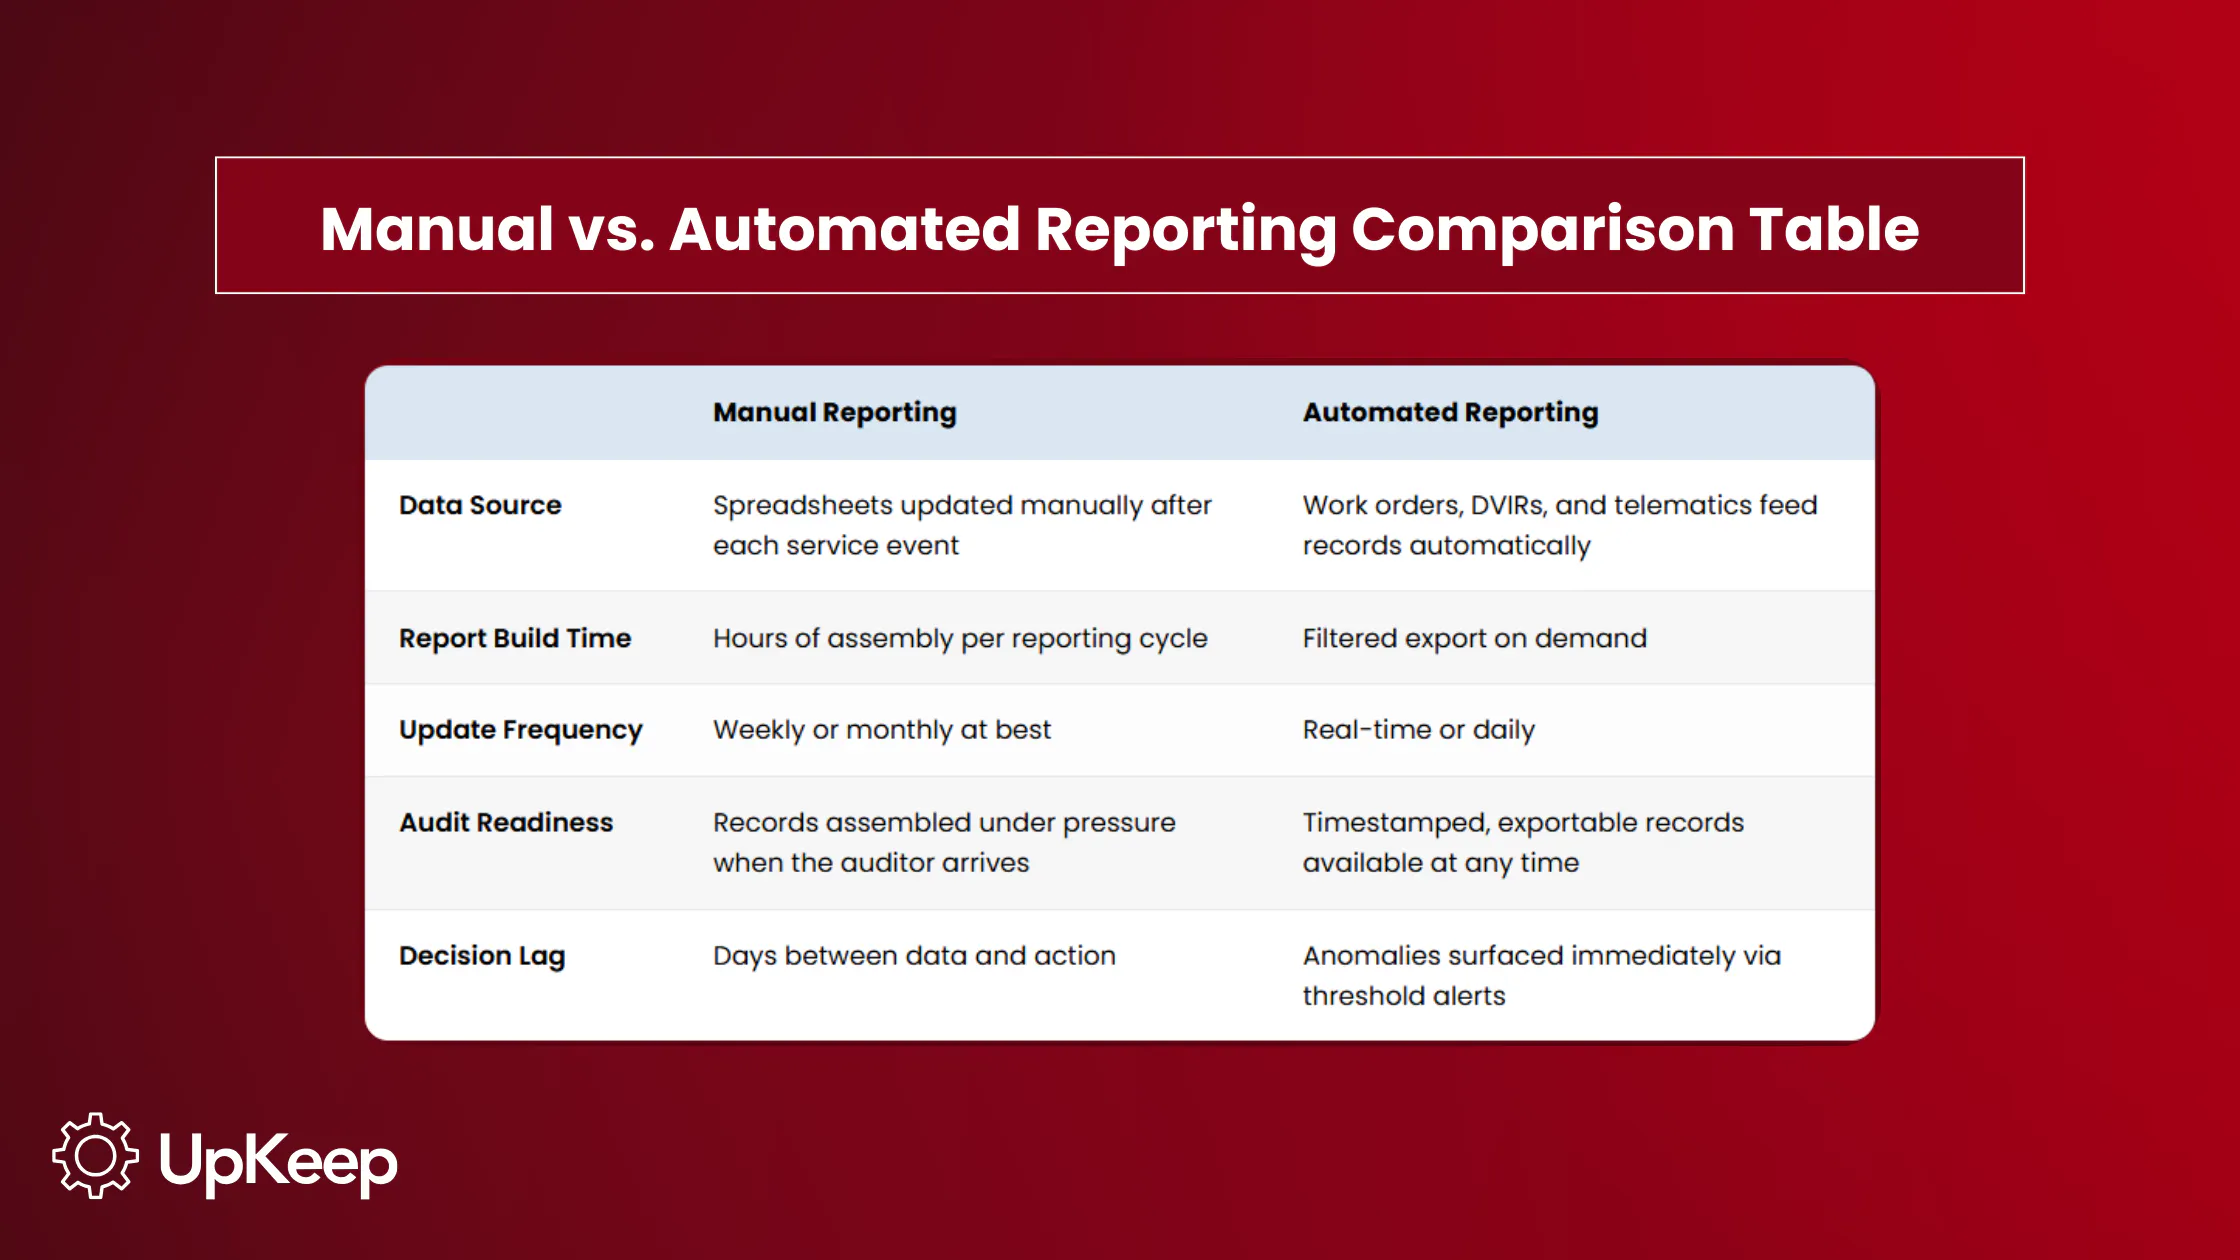
Compliance records generated through a reporting system are exportable on demand, which eliminates the manual collection and assembly that turns a routine audit request into a multi-day project.
Manual reporting cycles create a decision lag between when a problem develops and when it reaches the right person. Automated reporting closes that gap. A CPM spike or a slipping inspection rate reaches the fleet manager in the week it develops, not after the damage has compounded.
A fleet maintenance program generates data constantly, from work orders and DVIRs to parts purchases, repair costs, and downtime hours. Yet, it often isn’t organized into a format that drives decisions, instead causing expensive consequences.
Costs accumulate at the vehicle level but are reviewed at the fleet level, which skews estimates. PM schedules also slip, resulting in a spike in emergency repairs weeks later. Meanwhile, compliance records exist on paper but aren’t easily produced on demand. The data exists, but the reporting infrastructure to surface it in time doesn’t.
A fleet maintenance report is the analytical layer that closes that gap by converting accumulated work orders, inspection results, and cost entries into the per-vehicle metrics that support operational decisions before the budget has absorbed the damage.
Maintenance and repair costs represent a significant share of fleet operating expenses. Industry data shows repair and maintenance average about $0.196 per mile, roughly 10% of total trucking operating costs, which is why identifying problem vehicles early is critical.
What Is a Fleet Maintenance Report?
A fleet maintenance report is a structured summary of vehicle health, service history, and operating costs that makes maintenance program performance visible and actionable.
It covers the metrics that determine whether the fleet is running efficiently, which assets consume greater budget, and whether the operation is meeting its compliance obligations.
Two documents are related but serve different functions:
A maintenance log is the raw record of every service event captured at the asset level.
A work order authorizes and tracks a specific repair or PM event from request to completion.
The fleet maintenance report sits above both: It aggregates what the log contains and what work orders have produced into the per-vehicle comparisons and trend data that support operational decisions. Without it, the data exists but doesn’t inform.
Why Fleet Maintenance Reports Matter
A fleet of 35 trucks may look healthy on paper: Total maintenance spend is within budget, average CPM is $0.11, and no major breakdowns occurred this month. Pull the same data by vehicle though, and the picture changes:


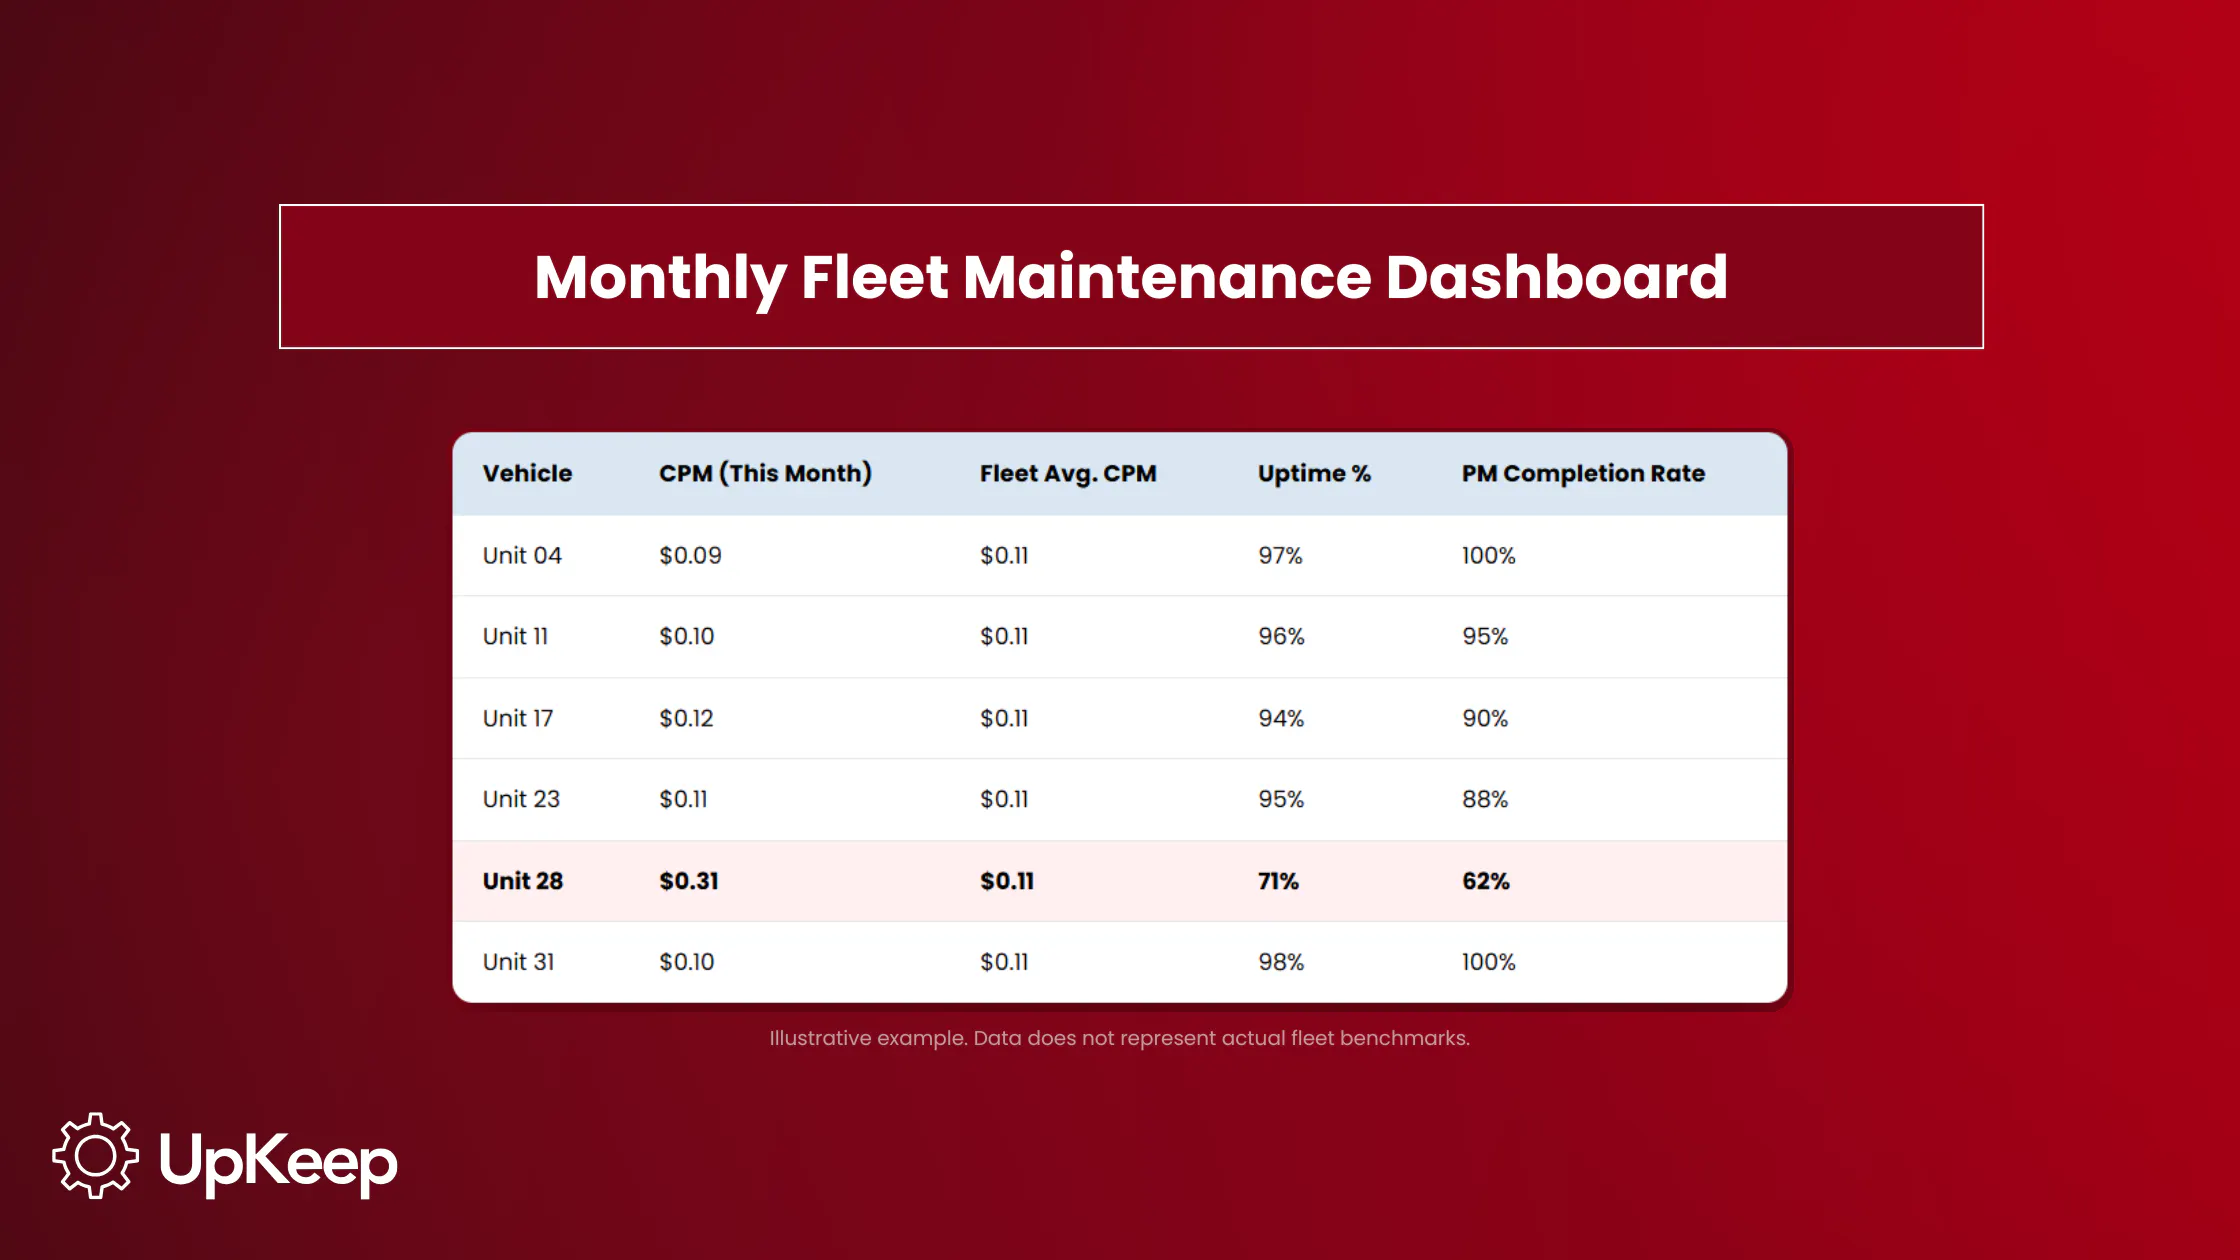
Unit 28 in the table above is the problem the fleet-level average buried. At $0.31 per mile, nearly three times the fleet average, it has absorbed a disproportionate share of repair spend for the month. Its uptime is 71%, meaning it was unavailable for nearly a third of the period, and PM completion is at 62%, which means scheduled services are being skipped or deferred. That combination, with low PM compliance, feeding low uptime, and high CPM, reveals a concerning pattern.
A monthly dashboard that breaks down CPM, uptime, and PM completion by asset turns a budget conversation into a decision about a specific vehicle. A fleet that generates daily DVIRs produces hundreds of inspection records a month, and when they’re organized and exportable, that’s an audit response; scattered across paper forms, it’s a liability.

The Six Core Fleet Maintenance Reports
Each report type connects to a specific operational question. The goal is to match each one to the decision it drives and the person responsible for acting on it.
|
Report Type |
What It Measures |
Decision It Drives |
Who Receives It |
|
Cost Per Mile |
Total maintenance spend ÷ miles driven, per vehicle |
Replacement candidates above fleet average CPM |
Fleet manager, finance |
|
Preventive vs. Reactive |
Ratio of planned service to emergency repairs |
PM program health; rising reactive share = early warning |
Fleet manager, ops leader |
|
Work Order Detail |
Turnaround time from work order opened to vehicle returned |
Shop bottleneck identification |
Maintenance supervisor |
|
Downtime & Availability |
Uptime % per vehicle; time out of service by cause |
Root cause analysis for chronic low-availability assets |
Fleet manager, ops leader |
|
DVIR & Inspection Compliance |
Daily inspection completion rate; defect-to-repair lag |
Driver accountability; program gap correction |
Fleet manager, compliance |
|
Parts & Inventory Spend |
Parts usage by component; stockout frequency |
Reorder thresholds; highest-cost component identification |
Maintenance supervisor, procurement |
1. Cost Per Mile Report
CPM is the financial baseline for every replacement and budgetary decision in the fleet. It’s calculated by dividing the total maintenance spend by miles driven per vehicle. Check it monthly and compare each vehicle against both the fleet average and its own prior-month trend.
A single high month warrants investigation, but a persistent upward trend warrants a replacement conversation. The report makes the data available before the budget absorbs another month of avoidable spend.
2. Preventive vs. Reactive Work Order Report
The ratio of planned service to emergency repairs precedes an increase in breakdown frequency, so it serves as the program’s earliest warning signal. Most programs target a ratio weighted heavily toward preventive work. Sustaining a preventive-heavy maintenance mix is a core principle of fleet maintenance best practices.
The exact threshold matters less than the direction: A ratio moving toward parity means PM is slipping and emergency repair volume is rising. Catching that shift in the report results in simply correcting a scheduling or resourcing gap. Missing it means the gap shows up as a repair bill.
The report also identifies which vehicles drive the reactive share. A fleet-wide ratio of 70/30 tells you something is wrong, while breaking it down by asset pinpoints where.
3. Work Order Detail and Completion Report
Turnaround time, from work order creation to vehicle returned to service, is the primary measure of shop efficiency. This report uncovers bottlenecks that extend downtime beyond what the repair itself requires, such as parts that had to be ordered rather than pulled from inventory, approvals that sat in an inbox, or technician availability gaps that delayed the work.
A spike in turnaround time concentrated on a specific work order type points to a problem with the process, not capacity. The distinction matters because the fix is different, as a process issue is correctable without adding head count. The report makes that distinction visible before the assumption is made.
4. Downtime and Availability Report
Uptime percentage per vehicle, which gauges operational time versus shop time, is the measure most directly tied to service delivery. A vehicle that’s unavailable when needed creates a maintenance cost and a service failure. This report tracks availability per asset over time and flags vehicles with chronic low-availability patterns.
When a vehicle returns to the shop repeatedly for the same system failure, the individual work orders look like separate events. However, the downtime report makes the recurrence visible across time and signals the repair is treating a symptom rather than the underlying cause.
5. DVIR and Inspection Compliance Report
Daily inspection completion rate and the time elapsed between a defect logged and a repair scheduled are the two metrics this report tracks. When the completion rate falls, defects accumulate, and the gap between what’s on the road and what’s been checked widens until something fails. The defect-to-repair lag shows how long that gap stays open after a problem is identified: A short lag means inspections connect to action, while a long one means they connect to paperwork.
Commercial motor vehicles in interstate commerce are subject to pre-trip inspection requirements under 49 CFR 392.7 and DVIR reporting requirements under 49 CFR 396.11.
Records themselves have to follow retention requirements under 49 CFR 396.21 and must be produced during a compliance review. Missing or incomplete records can trigger violations even when the underlying inspections were performed. This report is how you confirm both the program is running and the documentation holds up.
6. Parts and Inventory Spend Report
Parts cost as a percentage of total maintenance spend, broken out by component type and vehicle, shows which assets and which components drive the highest ongoing spend.
Tracking consumption alongside work orders also spotlights stockout impact. When parts unavailability extends turnaround time, it shows up here as delayed completions rather than disappearing into downtime totals.
Three brake jobs on Unit 28 (see previous example) in six months may look like normal wear in the work order history. However, the parts report is what surfaces it as a frequency problem, at which point the question shifts from whether to order more brake pads to whether the underlying cause has been addressed.
Key Metrics Every Fleet Maintenance Report Should Include
The following KPIs make fleet maintenance program performance measurable. Each belongs in a specific report type, and the most useful monthly dashboards pull the core indicators together in one view:
|
KPI |
What It Measures |
Report Home |
|
Cost Per Mile (CPM) |
Total maintenance spend ÷ miles driven, per vehicle |
Cost Per Mile Report |
|
PM Completion Rate |
Scheduled services completed on time |
Preventive vs. Reactive Report |
|
Preventive-to-Reactive Ratio |
Share of planned vs. emergency work orders |
Preventive vs. Reactive Report |
|
Mean Time Between Failures (MTBF) |
Average operating time between unplanned breakdowns |
Downtime & Availability Report |
|
Maintenance Turnaround Time |
Work order opened to vehicle returned to service |
Work Order Detail Report |
|
Uptime Percentage |
Operational time vs. shop time per vehicle |
Downtime & Availability Report |
|
DVIR Completion Rate |
Daily inspection completion as a percentage of the number required |
DVIR & Inspection Report |
Three additional metrics worth tracking alongside the core set are recall response time (how quickly manufacturer safety recalls are addressed after NHTSA VIN lookup identifies affected vehicles), first-time fix rate (repairs completed correctly on the first visit), and inventory turnover (parts usage efficiency relative to stock levels).
How to Build a Fleet Maintenance Report
The report is only as accurate as the inputs behind it, so be thorough when creating your own.
Define report cadence by audience. Each relevant party needs a different level of granularity and a different set of questions answered. A daily dashboard for a shop supervisor shows open work orders, vehicles currently down, and parts on order. A weekly summary for a fleet manager shows PM completions, DVIR compliance rate, and vehicles that slipped schedule. A monthly leadership report shows CPM trends, preventive-to-reactive ratio, and MTBF.
Standardize data inputs before building report templates. The report draws from three upstream sources: daily DVIRs and inspection checklists, which capture defects and service events at the point of discovery; the maintenance log, which records every service event per vehicle with cost, mileage, and labor; and work order records, which track repair completions and turnaround time. Reports built on incomplete entries from any of these sources will produce misleading numbers. Establish what must be recorded, by whom, and when before the first report cycle runs.
Build from the vehicle level. Fleet-level aggregates set the baseline, while per-vehicle records expose the outliers. CPM, downtime, and failure patterns only become actionable when broken out by asset.
Set exception thresholds. The report shouldn’t require someone to manually scan each row every cycle. Configure alerts that sound when vehicles are above the CPM threshold, assets have DVIR completion rates below target, or work orders with turnaround time fall outside the acceptable range. The report becomes an action trigger, not just a status document.
Connect every report to an owner and a decision. Define who receives each report, what question it answers, and what action or escalation it triggers. A report that no one acts on only creates the appearance of oversight.
Download: Fleet Maintenance Templates
Fleet Maintenance Tracking Workbook (Excel) — Six tracking tabs covering CPM, PM ratio, work order turnaround, downtime, DVIR compliance, and parts spend. Enter data from your maintenance logs and inspection records; the workbook calculates fleet averages and flags exceptions automatically.
Fleet Maintenance Report Template (Word) — A one-page formatted report that pulls headline figures from the workbook into a leadership-ready summary. Fill it in monthly, hand it to your ops director, or export it as a PDF
How to Automate Fleet Maintenance Reporting
Manual reporting expends more time on assembly than analysis. A fleet manager who has to pull work order data, match parts costs, and calculate CPM per vehicle is transcribing, not managing.
The consequence is a reporting delay (possibly with inaccuracies) that works against the program. A vehicle that crossed the CPM threshold three weeks ago may only show up on the report today. Meanwhile, an inspection rate that started slipping in week one doesn't trigger a correction until the monthly review, by which point the problem has already compounded.
Fleet maintenance software closes that gap by generating records as work happens. Work orders create cost and downtime entries at completion, while DVIRs logged on mobile devices feed inspection compliance data in real time. Finally, telematics alerts connect fault codes directly to work order creation.
Reports become filtered exports rather than assembly projects. A fleet manager who needs last month's CPM breakdown by vehicle can easily find it in a query, not after an afternoon of spreadsheet work. The bottleneck shifts from building the data to acting on it.
From Scattered Records to Operational Control
The most expensive fleet problems are the result of data failing to reach the right person in time.
A reporting infrastructure shrinks that delay. Cost anomalies appear in the same week they develop, rather than after someone eventually builds the report. PM compliance gaps reach the fleet manager as a declining ratio before they spiral into breakdowns, and replacement decisions are backed by the full per-vehicle cost history, not a gut read on mileage and age. The fleet becomes controllable because the data loop closes fast enough to act on what it finds.
UpKeep centralizes work orders, DVIRs, asset history, and inventory in one platform, so the records that feed your reports are generated continuously as work is completed. From the inspection checklist that spots a defect and the maintenance log that records the repair to the report that uncovers the cost pattern, the platform catches it all. Managing fleet maintenance in one system connects the reporting layer directly to the workflow that produces its data.
The report is the input: fewer surprise breakdowns, tighter PM compliance, defensible replacement decisions, and audit-ready records. Operational control shortens the time between when a problem develops and when someone acts on it.
Frequently Asked Questions
What should be included in a fleet maintenance report?
A complete fleet maintenance report covers vehicle identification, service history, PM schedule status, cost breakdown by vehicle and event, inspection results, downtime tracking, and parts spend. Actionable reports also include per-vehicle CPM, preventive-to-reactive ratio, MTBF, maintenance turnaround time, and DVIR completion rate.
What’s the difference between a fleet maintenance report and a maintenance log?
A maintenance log captures every service event at the asset level: what was done, when, by whom, and at what cost. The fleet maintenance report aggregates that data into the comparisons that support decisions — which vehicle to investigate, whether the PM program is holding, and whether the compliance record is current. The log is the source; the report is the analysis built on top of it.
How often should fleet maintenance reports be generated?
Cadence depends on the audience. Shop supervisors benefit from daily dashboards showing open work orders and vehicles currently down. Fleet managers typically review weekly summaries covering PM completions and DVIR compliance. Leadership reports covering CPM trends, preventive-to-reactive ratio, and MTBF are most useful monthly. Exception alerts — vehicles crossing CPM thresholds, inspection rates dropping — should surface in real time.
Which fleet maintenance KPIs matter most?
Cost per mile, preventive-to-reactive ratio, MTBF, maintenance turnaround time, uptime percentage, and DVIR completion rate are the core set. CPM and uptime connect most directly to budget and service delivery. The preventive-to-reactive ratio and PM completion rate are the program health indicators; they tell you whether the maintenance operation is running as designed before the consequences show up elsewhere.
How do I automate fleet maintenance reporting?
Automation starts with centralizing the data sources. When work orders, DVIRs, and parts records flow through a single system, reports become filtered exports rather than manual assembly projects. Fleet maintenance software connected to telematics can generate fault-to-work-order workflows automatically, so records are created as work happens.
Can small fleets benefit from formal reporting?
Small fleets operate with less margin for error — a single vehicle with a chronic failure pattern or an uninvestigated CPM spike has a proportionally larger budget impact than in a large fleet. A structured reporting cadence doesn’t require software at the outset; a monthly spreadsheet review of per-vehicle cost and PM completion builds the discipline. The reporting methodology scales, but the urgency doesn’t.
4,000+ COMPANIES RELY ON ASSET OPERATIONS MANAGEMENT
Leading the Way to a Better Future for Maintenance and Reliability
Your asset and equipment data doesn't belong in a silo. UpKeep makes it simple to see where everything stands, all in one place. That means less guesswork and more time to focus on what matters.