What Is MTTR? The Metric, Explained
Key Takeaways
-
MTTR gives a repeatable read on how quickly failed equipment gets back into production. When tracked consistently, it shows which repairs run long and where a delay sits.
-
Defining what counts as repair time before you track it makes the number usable. Some teams measure active maintenance work, while others count the full period from failure to restored operation.
-
Breaking the repair cycle into intervals tells you where to intervene. Diagnosis, parts availability, asset history, approvals, and access to the right expertise each extend repair time in ways a single average conceals.
-
Consistent timestamps do more for the metric than a sophisticated formula. Recording failures, work starts, and completions the same way every time makes MTTR comparable month over month.
-
Reading MTTR next to MTBF keeps you from rewarding the wrong result. Faster repairs on an asset that keeps failing is a reliability problem wearing a maintenance win.
It’s a familiar scene: A packaging line goes down at 6 a.m. The shift supervisor reports the failure, but the technician who knows the machine is already working on another job. When they arrive, the fault isn’t what the operator originally described, so diagnosis takes another hour. Then the tech finds out the required bearing isn’t in stock.
The repair itself takes just 90 minutes, yet the line doesn't restart until 3 p.m. From a maintenance standpoint, that failure cost the operation nine hours.
That distinction sits at the center of MTTR. If you neglect it, you get a number that looks useful on a dashboard and resists any attempt to act on it. But when tracked consistently, the metric shows how quickly failed equipment returns to service, which repairs take unusually long, and where delays occur.
What Is MTTR?
MTTR most commonly stands for mean time to repair in physical asset maintenance. It measures the average amount of time required to repair a failed asset. The basic formula for it is:
MTTR = Total Repair Time ÷ Number of Repairs
So, if four pump failures required a combined 14 hours of repair work during a quarter, it’d look like this:
14 hours ÷ 4 repairs = 3.5 hours MTTR
You can also skip the math and just use UpKeep’s own calculator.
The acronym is used in IT and incident management as well and stands for the mean time to recovery, resolution, or response. But for maintenance teams responsible for equipment such as pumps, conveyors, HVAC systems, or vehicles, mean time to repair is the relevant metric.
To further complicate things, authoritative maintenance references set different time boundaries for MTTR. For instance, the SMRP defines repair or replacement time from the moment an asset stops operating until its operability is restored, including the functional checks before it's handed back to operations. NASA, meanwhile, describes MTTR as the average elapsed time required to perform corrective maintenance, covering fault isolation and correction.
That difference matters. A team using a corrective-maintenance window will report a much shorter MTTR than a team that starts the clock at failure, even when both are looking at the same event.
Consider the packaging line from the opening example.
|
Measurement |
Start |
End |
Result |
|---|---|---|---|
|
Active repair time |
Repair begins |
Repair is completed |
1.5 hours |
|
Full restoration time |
Equipment fails |
Equipment returns to service |
9 hours |
The 1.5-hour figure represents active repair time. A corrective-maintenance MTTR may also include diagnosis, testing, or other maintenance tasks depending on the definition in use. The nine-hour figure represents the full restoration window from failure to returned service.
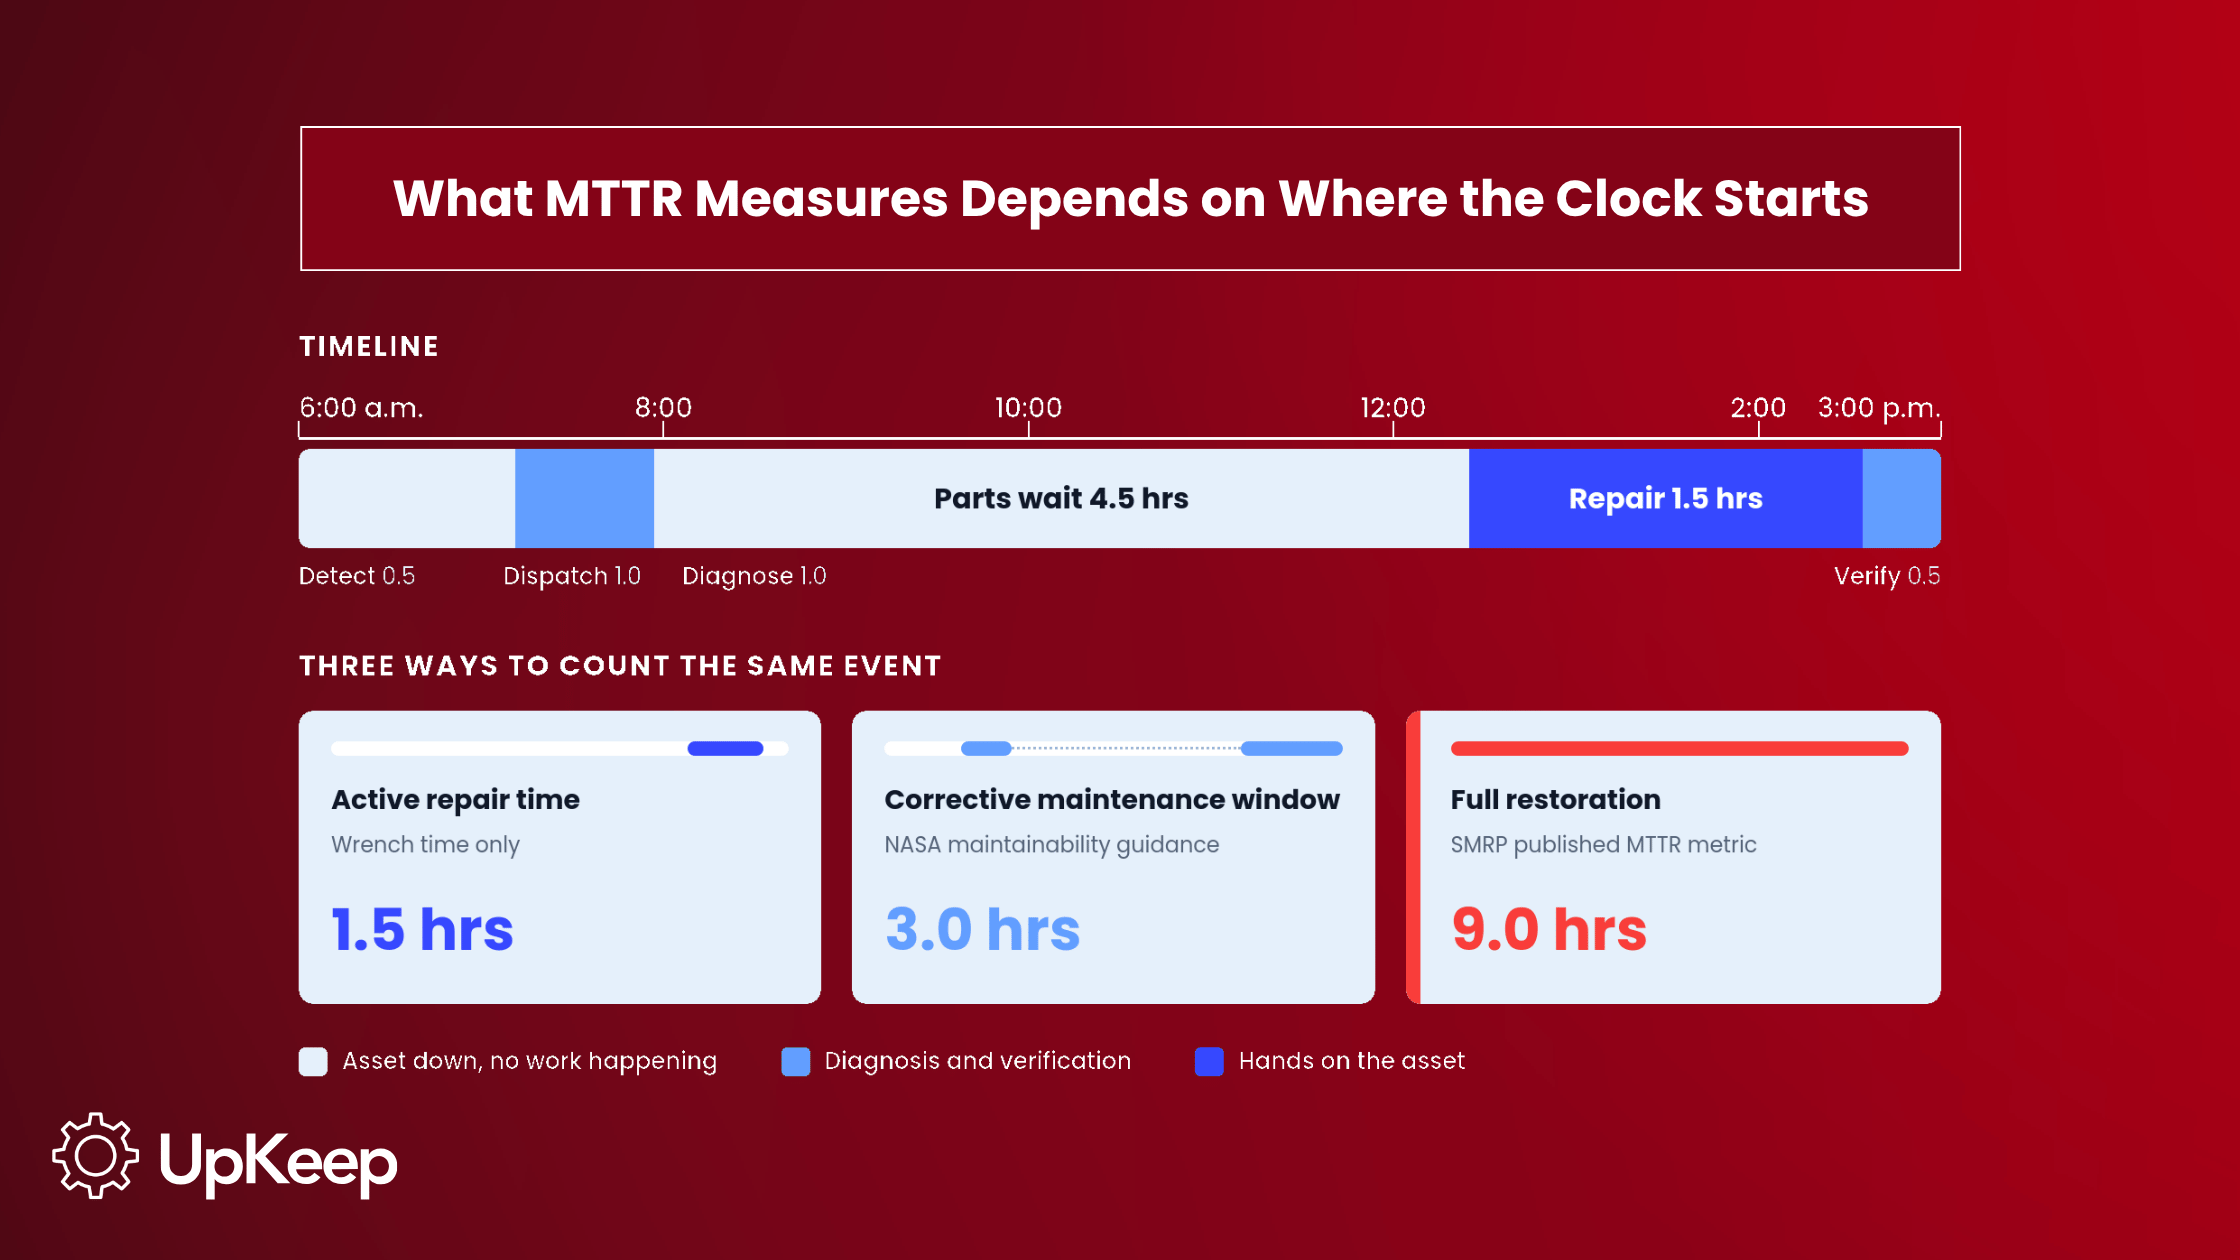
Consistency is key here. Define the boundary your organization uses, document it, and compare only figures calculated on the same basis. If one facility counts the full outage while another counts only corrective-maintenance activity, their MTTR figures aren't directly comparable.
Set the Right Foundation for MTTR
As shown above, the MTTR formula is straightforward. The hard part is deciding what belongs inside the "repair time" variable. Before you calculate anything, define six elements: when the clock starts, when it stops, whether diagnosis time is included, whether travel time is included, whether parts and approval delays are included, and how reopened or repeat work orders are handled.
Then apply those rules the same way across assets, technicians, shifts, and reporting periods:
-
If you're measuring active repair time, start the clock when maintenance work begins and stop it once the asset has been repaired and tested.
-
If you're measuring total restoration time, start when the failure is detected and stop once the asset is returned to service.
Both are legitimate. Just avoid comparing a number built on one definition to a benchmark or a facility using another.
Track the Intervals Behind the Number
One start timestamp and one end timestamp give you an average and nothing else. Fora comprehensive diagnosis, you need to capture four points in the repair process:
-
Failure detected
-
Work order assigned
-
Repair work started
-
Asset returned to service
If failures are reported quickly but repair starts are consistently delayed, look at technician availability or dispatching. If repairs start quickly and take a long time to finish, the problem sits in diagnosis, tooling, parts, or repair procedures. The average alone can't tell you which, but the intervals can.
Extraordinary events need careful handling. A flood or a major electrical incident will distort an average built mostly on routine failures. Pulling those events out makes the metric look better without telling you anything, so document how they're classified and report routine and exceptional failures separately.
Why MTTR Matters Operationally
Every hour a critical asset stays unavailable causes ripples that reach past the maintenance department. On a production line, downtime means units don't get produced, and the schedule has to absorb the loss. In a fleet, a vehicle sits while its routes are reassigned. In a facility, an HVAC or electrical failure affects occupants and generates its own wave of service requests.
Long repairs also disrupt planned maintenance. When technicians spend more time than expected on emergency work, preventive maintenance gets postponed. Over time, that pushes the team further toward reactive work. MTTR is what makes those patterns visible.
Where Repairs Get Stuck
A rising MTTR doesn't necessarily mean technicians are doing repairs poorly. The delay usually sits somewhere else in the process, such as:
-
Diagnosis takes too long because the fault isn't what the operator described.
-
The required part isn't on the shelf.
-
Previous repair history is buried in a filing cabinet or a former technician's memory.
-
A specialist has to be called in from another site.
-
Purchase approval waits on someone answering a phone.
-
Repair instructions are incomplete, or the asset is difficult to access safely.
Breaking the total repair cycle into smaller intervals separates repair execution from the process around it, which is the difference between retraining a technician and fixing a storeroom.
Repeat Failures
Suppose an asset generates work orders every few weeks, and each repair takes several hours. Repair speed isn't the whole story. The same failure mode keeps returning because the underlying cause hasn't been addressed, and the hours going into repeated fixes are the cost of not finding it. Here, MTTR needs to be read alongside asset history and failure data instead of treated as a standalone performance score.
If MTTR looks stable while downtime costs keep climbing, check how the metric is being recorded. A work order opened only when a technician begins work excludes every hour the asset was already down.
What Drives Up MTTR?
A few issues can cause MTTR to increase in a facility. Look for the following culprits to take the first step towards a lower MTTR.
Parts Unavailable
A repair may take just an hour of hands-on work but keep an asset unavailable for days if the required component isn't in stock. Looking at wrench time and parts wait time separately prevents a supply problem from being mistaken for poor technician performance.
Scattered Asset History
Troubleshooting takes longer when technicians can't quickly see what happened during previous failures. Past work orders show which components were recently replaced, which faults recur, what troubleshooting has already been tried, and which temporary fixes are still in place. Without that context, every failure becomes a new investigation.
Inconsistent or Vague Failure Descriptions
Free-text notes can miss useful details and make recurring problems nearly impossible to spot at scale. Standardized failure codes give teams a consistent way to classify faults while technicians add notes where they matter. As a result, those codes uncover repeated failure modes and shorten diagnoses.
Approval and Escalation Delays
A technician may know exactly which part or service is required but still have to wait on authorization. For smaller purchases, weigh the control an approval provides against the downtime it creates.
Knowledge Concentrated in One Technician
If a single tech is the only one who can diagnose a particular asset, repair time depends on that person's shift schedule. Documented procedures, accessible asset history, and cross-training reduce the dependency.
Metrics to Track Alongside MTTR
MTTR tells you how long repairs take. It won't tell you whether those repairs are lasting, whether maintenance demand is climbing, or why repair time changed. To get the complete context, pair it with the metrics below.
|
Metric |
What it adds to MTTR |
|---|---|
|
MTBF (mean time between failures) |
Shows how long an asset operates between failures. Falling MTTR and MTBF indicate repairs are getting faster while reliability worsens. |
|
PM compliance |
Reveals if planned maintenance is being completed as scheduled. Declining compliance points to a rise in reactive failures. |
|
Parts stockout frequency |
Identifies whether long repair cycles are driven by unavailable components instead of repair execution. |
|
Work order backlog age |
Shows whether maintenance capacity or prioritization is becoming the constraint. |
|
First-time fix rate |
Pinpoints repairs that close quickly and then require repeat visits or follow-up work. |
|
Vehicle uptime % |
Gives fleet teams a direct view of how repair performance affects vehicle availability. |
|
Emergency repair ratio |
Shows how much of the maintenance workload is reactive. |
How to Reduce MTTR
Reducing MTTR starts with identifying which part of the repair process is consuming the time. From there, you can address the root cause of the problem.
1. Standardize Failure Codes
Give each asset class a consistent set of failure codes and stop relying on free-text descriptions alone. Keep the list practical enough that a technician can pick the right code without scrolling through dozens of near-identical options.
Once failure data becomes consistent, patterns surface. Teams spot recurring modes and start troubleshooting from history instead of from scratch, which is where the diagnosis time comes back.
2. Stock Critical Spares Based on Risk
Not every spare part deserves shelf space. Prioritize based on asset criticality, downtime cost, supplier lead time, failure frequency, and whether an alternative part will do the job. A component that rarely fails still justifies sitting on-site when the asset is critical and replacement lead time runs several days.
3. Make Asset History Available at the Point of Work
Technicians should see previous repairs, parts replacements, fault history, and open issues without having to walk back to a desktop or digging through paper records. Mobile access, QR codes, and asset tags connect the physical asset directly to its digital history. UpKeep centralizes that information in the asset record, so technicians can review previous work orders and related maintenance information while they're standing in front of the equipment.
4. Remove Unnecessary Approval Delays
Review the steps sitting between diagnosis and repair. If technicians routinely wait on the same low-cost purchases or supervisor sign-offs, revisit your approval thresholds and escalation rules. Appropriate controls can stay. The goal is to keep routine decisions from holding critical equipment offline.
5. Capture Repair Timestamps as Work Happens
MTTR becomes much easier to trust when timestamps come from the same system technicians already use to manage their work. Record when service is requested, assigned, started, completed, and when the asset returns to operations.
UpKeep's Reliability Dashboard uses maintenance and work order data to uncover reliability metrics that include MTTR and MTBF, which reduces the need for a separate reporting process. Customers using its maintenance platform have also reported reduced equipment downtime by 26%.
Turning MTTR Into a Diagnostic
An operation without a defined MTTR runs on recollection. Repair intervals get recorded inconsistently, downtime cost shows up in the budget with no explanation attached, and the same assets fail repeatedly while nobody can say why. Every conversation about maintenance performance comes down to whose memory is more confident.
With a consistent definition in place, the picture changes. Repair time is measured the same way every time, so the number can be compared against itself month over month. Parts are stocked against what failure actually costs. Repeat failures surface in asset history early enough to fix the cause. MTTR read next to MTBF shows whether the work is holding.
That turns the metric into a question you can answer. If repair time is increasing, the intervals show where the additional time went. If repairs are getting faster, MTBF shows whether they're lasting. If technicians finish quickly and assets stay unavailable for hours, the gap sits before or after the repair itself.
UpKeep brings those records into one maintenance system, giving technicians asset history in the field while reliability dashboards turn recorded maintenance activity into metrics including MTTR and MTBF. If you’re curious to see how it works with your own assets, book a free trial today.
FAQ
What is a good MTTR?
There’s no single MTTR benchmark across every industry or asset type. You should leverage your own historical data as the starting point instead. Establish a baseline using a consistent definition, then compare similar assets and failure types over time. Only look at external benchmarks when they use a comparable MTTR definition.
Does MTTR include waiting for parts?
It depends on how your organization defines the metric. A narrower MTTR measures active repair work and excludes parts delays. A broader restoration measurement covers the entire period between failure and return to service. Whichever approach you use, document and apply it consistently. If parts delays are operationally significant, track them separately even when they sit outside your formal MTTR.
What's the difference between MTTR and MTBF?
MTTR measures how long repairs take. MTBF is the average operating time a repairable asset gets between failures. Together they give two views of asset performance; they reveal how frequently equipment fails, and how long recovery takes when it does. Review them together for a better understanding of your maintenance program.
How often should MTTR be reviewed?
The right frequency depends on repair volume. A facility with hundreds of repair events can review MTTR frequently without individual events distorting the result. A smaller operation needs a longer reporting period before trends mean anything. Monthly reporting is a practical starting point for most teams, with deeper analysis by asset class or failure type when a pattern appears.
Can you track MTTR without a CMMS?
Yes, but it’s harder. A spreadsheet works if repair events and timestamps are recorded consistently. At a minimum, they need to capture the asset, the failure date and time, the repair start time, the completion or return-to-service time, the failure type, and the repair performed. Maintaining that discipline during busy periods, when the data matters most, is difficult. A CMMS captures timestamps and repair records as technicians complete normal work order activities, which cuts duplicate data entry and makes long-term analysis easier.
4,000+ COMPANIES RELY ON ASSET OPERATIONS MANAGEMENT
Leading the Way to a Better Future for Maintenance and Reliability
Your asset and equipment data doesn't belong in a silo. UpKeep makes it simple to see where everything stands, all in one place. That means less guesswork and more time to focus on what matters.






![[Review Badge] Gartner Peer Insights (Dark)](https://www.datocms-assets.com/38028/1673900494-gartner-logo-dark.png?auto=compress&fm=webp&w=336)