Entrada en el Blog
11 CMMS Reports Every Maintenance Manager Should Check
11 CMMS reports every maintenance manager should track. Learn how to build them, find bottlenecks, cut downtime and costs, and balance leading vs lagging KPIs.


Key Takeaways:
CMMS reports combine multiple metrics to reveal hidden insights, like equipment that's both unreliable and expensive, or bottlenecks where requests get stuck before becoming work orders.
These 11 essential reports track everything from overdue work orders to money-pit assets costing more to maintain, with exact instructions for building each report in your CMMS.
Success requires clean data from your techs and regular review routines that balance leading indicators (what you control now) with lagging indicators (what already happened) to catch problems early.
What is a CMMS report?
A CMMS report combines multiple maintenance metrics to give you a complete picture of a specific area of your operations. For example, a report might show asset downtime (a metric) combined with repair costs (another metric) to highlight equipment that is both unreliable and expensive to maintain. These reports turn raw data into actionable insights that help you make better maintenance decisions.
Common CMMS Metrics
CMMS metrics are the numbers you track (counts, hours, costs, days) that you break down by location, equipment, or tech to answer specific questions. Think of this section as your cheat sheet — everything here feeds directly into the reports that follow.
Work Order Metrics
These metrics show how requests turn into scheduled work and how efficiently your team executes. Pair the speed/flow indicators (leading) with outcome metrics (lagging) so you can act before problems hit uptime or budget.
KPI | Indicator | What it tracks | Also impacts |
Work Order Count (Opened / Completed) | Lagging | Total WOs in a period | Costs |
Work Order Age (days) | Leading | Days since WO creation | — |
Time Past Due (days) | Leading | Days beyond the Due Date | — |
Cycle Time (days / hrs) | Lagging | Elapsed time request → completion (use built-in Average/Aggregate Cycle Time) | Costs |
Request Approved Percentage (%) | Leading | Share of requests approved | — |
Compliance Percentage (%) / Schedule Compliance | Leading | PM/plan adherence from built-in compliance measures | Costs |
Total Time Spent (hours) | Lagging | Labor hours logged per tech/team | Costs |
Asset Metrics
These metrics show reliability, economic health, and lifecycle stage — so you can decide when to maintain, overhaul, or replace. Pair leading indicators with lagging outcomes to build your replacement plans and justify capital.
KPI | Indicator | What it tracks | Also impacts |
Asset Availability (%) | Lagging | Uptime ÷ total time (built-in availability) | Work Orders, Costs |
Downtime (hours) | Lagging | Total downtime duration | Costs |
Number of Downtime Events | Lagging | Count of downtime incidents | Work Orders |
Mean Time to Repair (MTTR) | Lagging | Built-in MTTR / mean time on WO | Costs |
Useful Life (years) | Leading | Expected service life from asset record | Costs |
Total Maintenance Cost (period) | Lagging | Labor + parts cost on the asset | Work Orders |
Assets with Warranty Expiring (count) | Leading | Count of assets within a warranty window | Costs |
Inventory Metrics
These metrics reveal stock readiness and working-capital exposure so you can execute maintenance without delays or waste. Track both availability (leading) and value/usage (lagging) to optimize min/max levels, vendor mix, and transfers before you buy.
KPI | Indicator | What it tracks | Also impacts |
On-Hand Quantity (units) | Leading | Current stock by part/site/location | Work Orders |
Total Inventory Value ($) | Lagging | Dollar value of parts on the shelf | Costs |
Total Parts Consumed (qty) | Lagging | Units consumed in period | Costs |
Aggregate Parts Consumed Cost ($) | Lagging | Cost of parts consumed | Costs |
Vendor Spend (parts $) | Lagging | Total parts spend by vendor/SKU | Costs |
Top 11 CMMS Reports For Maintenance Managers
1) Work Order Aging


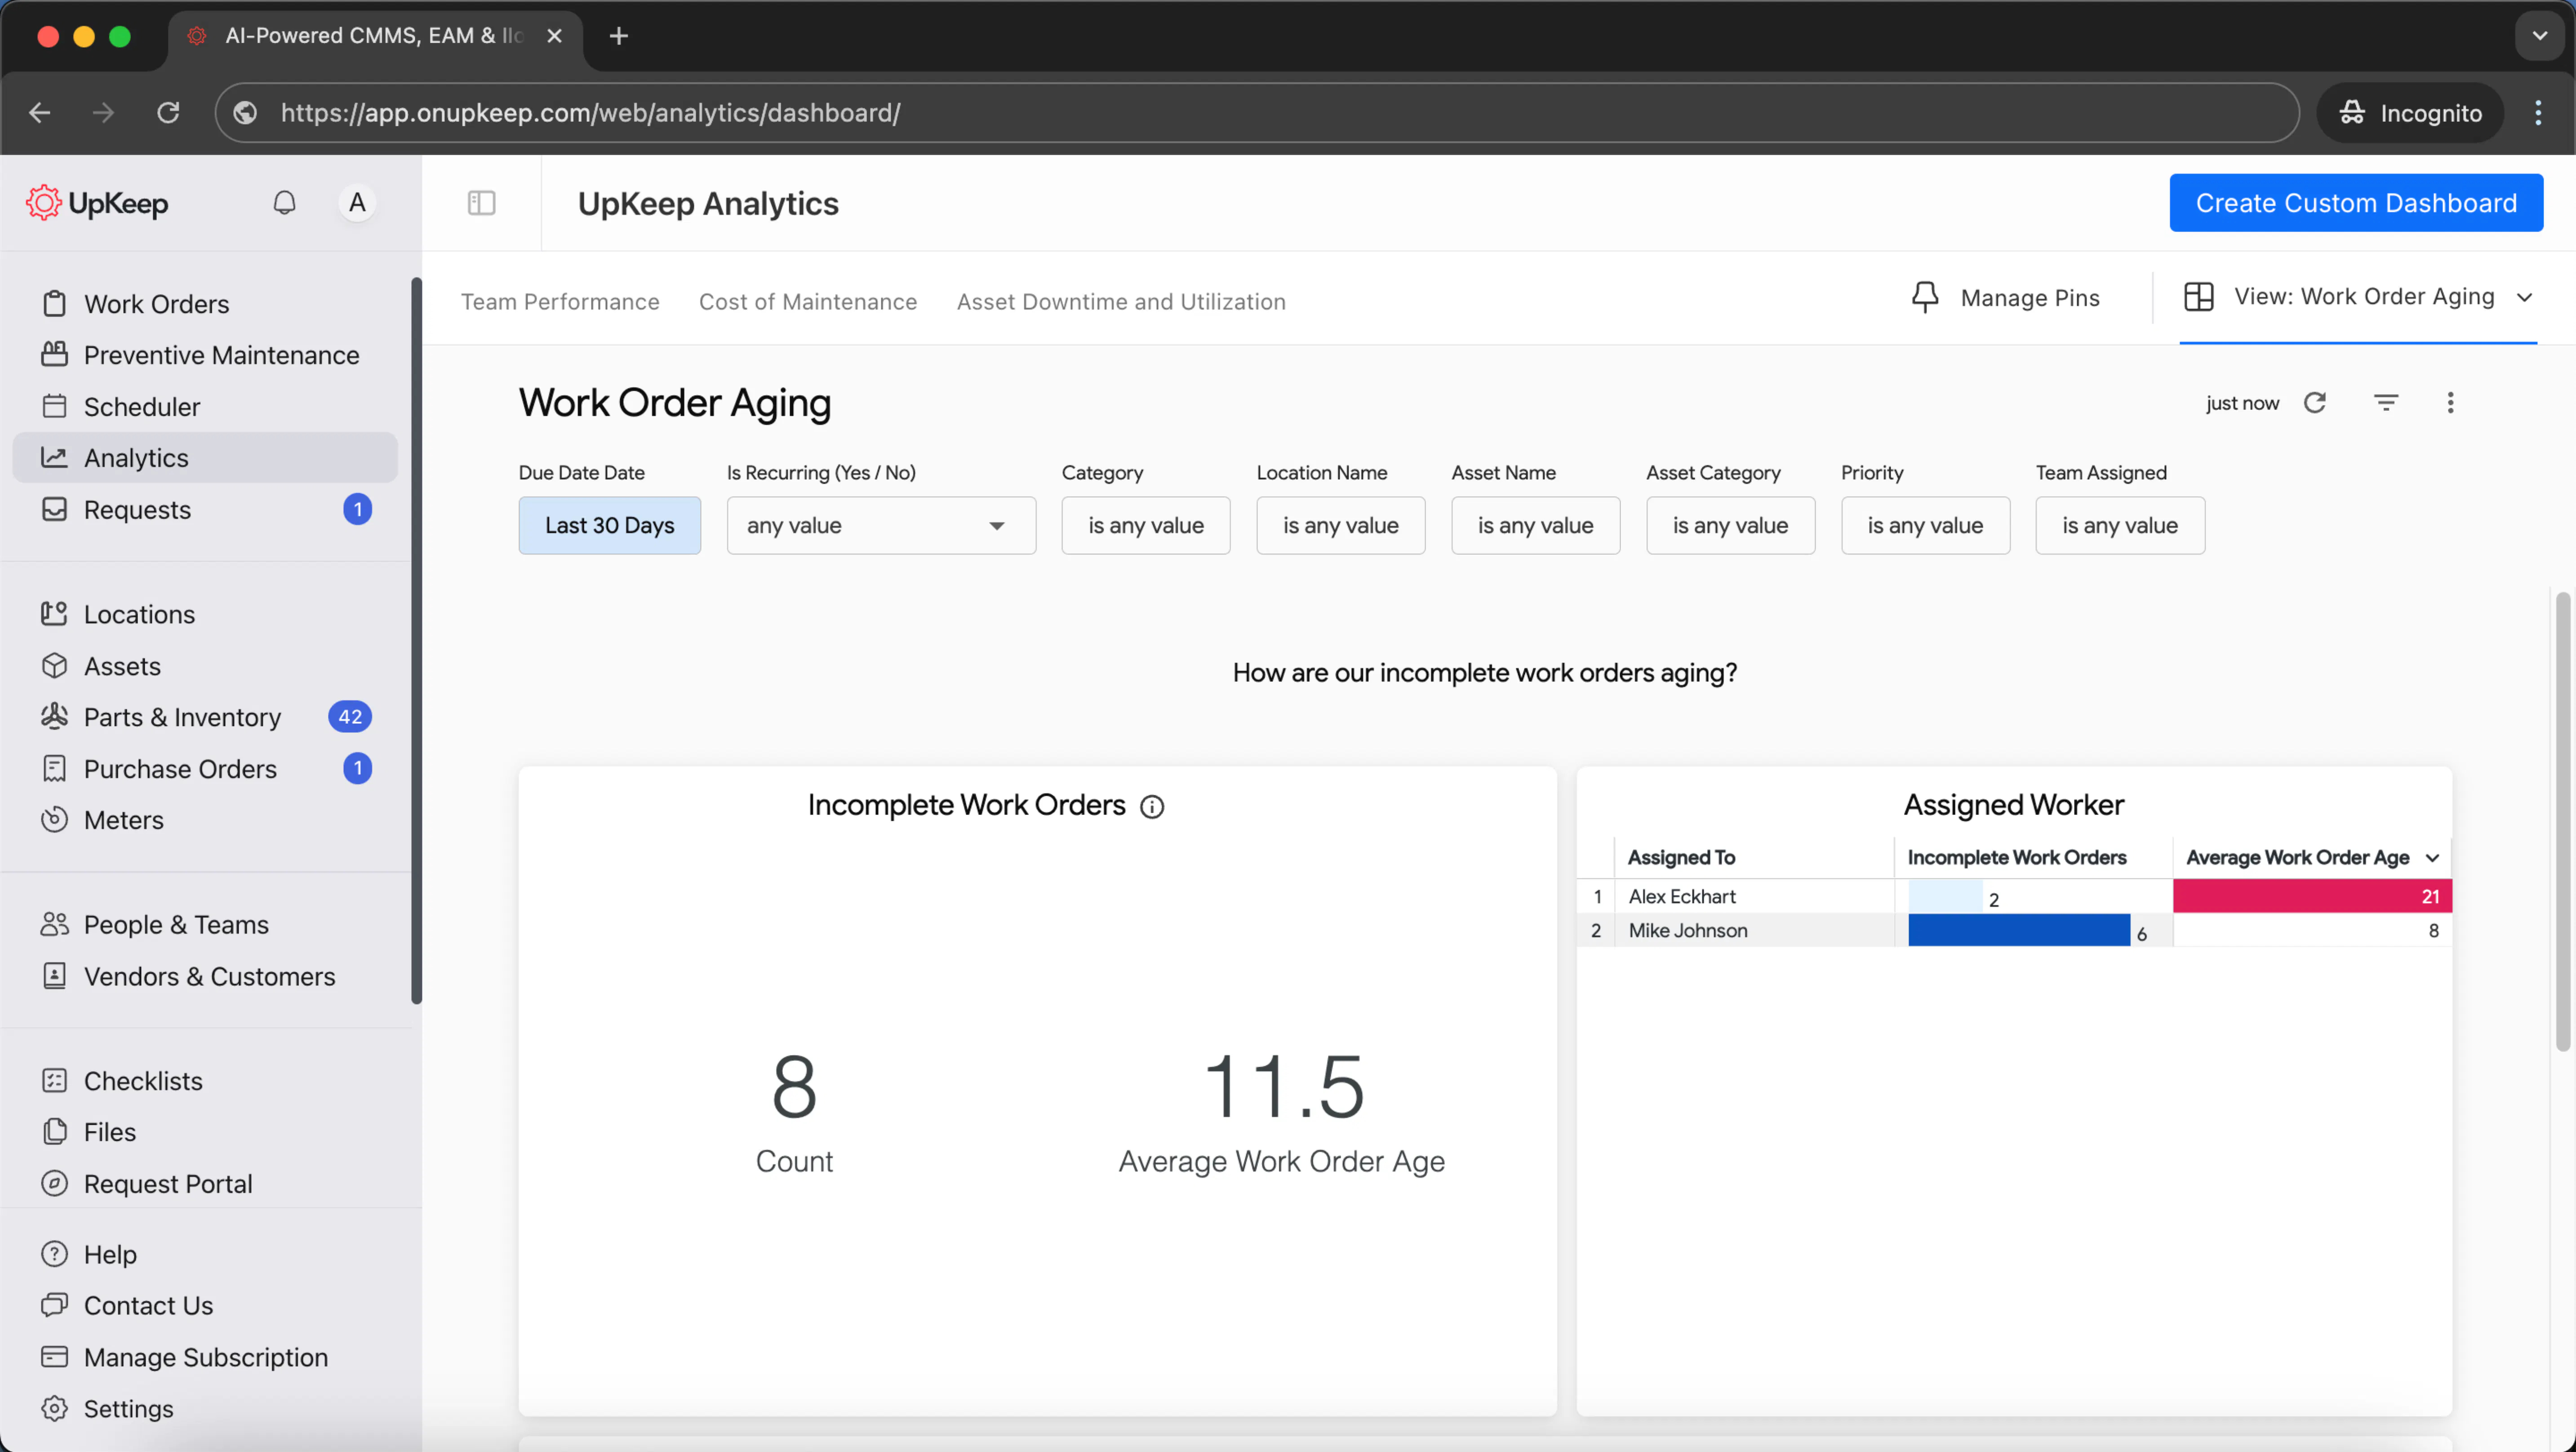
Build It in Upkeep
In Upkeep's report builder, set up your work order aging report with these configurations:
Dimensions: Site, Assigned To Full Name, Current Status, Work Order Due Date, Created Date, Title, ID, Time Past Due
Measures: Count
Filters: Is Complete = No (to show only open work orders)
Grouping: Site → Assigned To Full Name → Current Status
Sorting: Time Past Due (descending), then Work Order Due Date (ascending)
2) Assets Nearing End-of-Life (EOL)

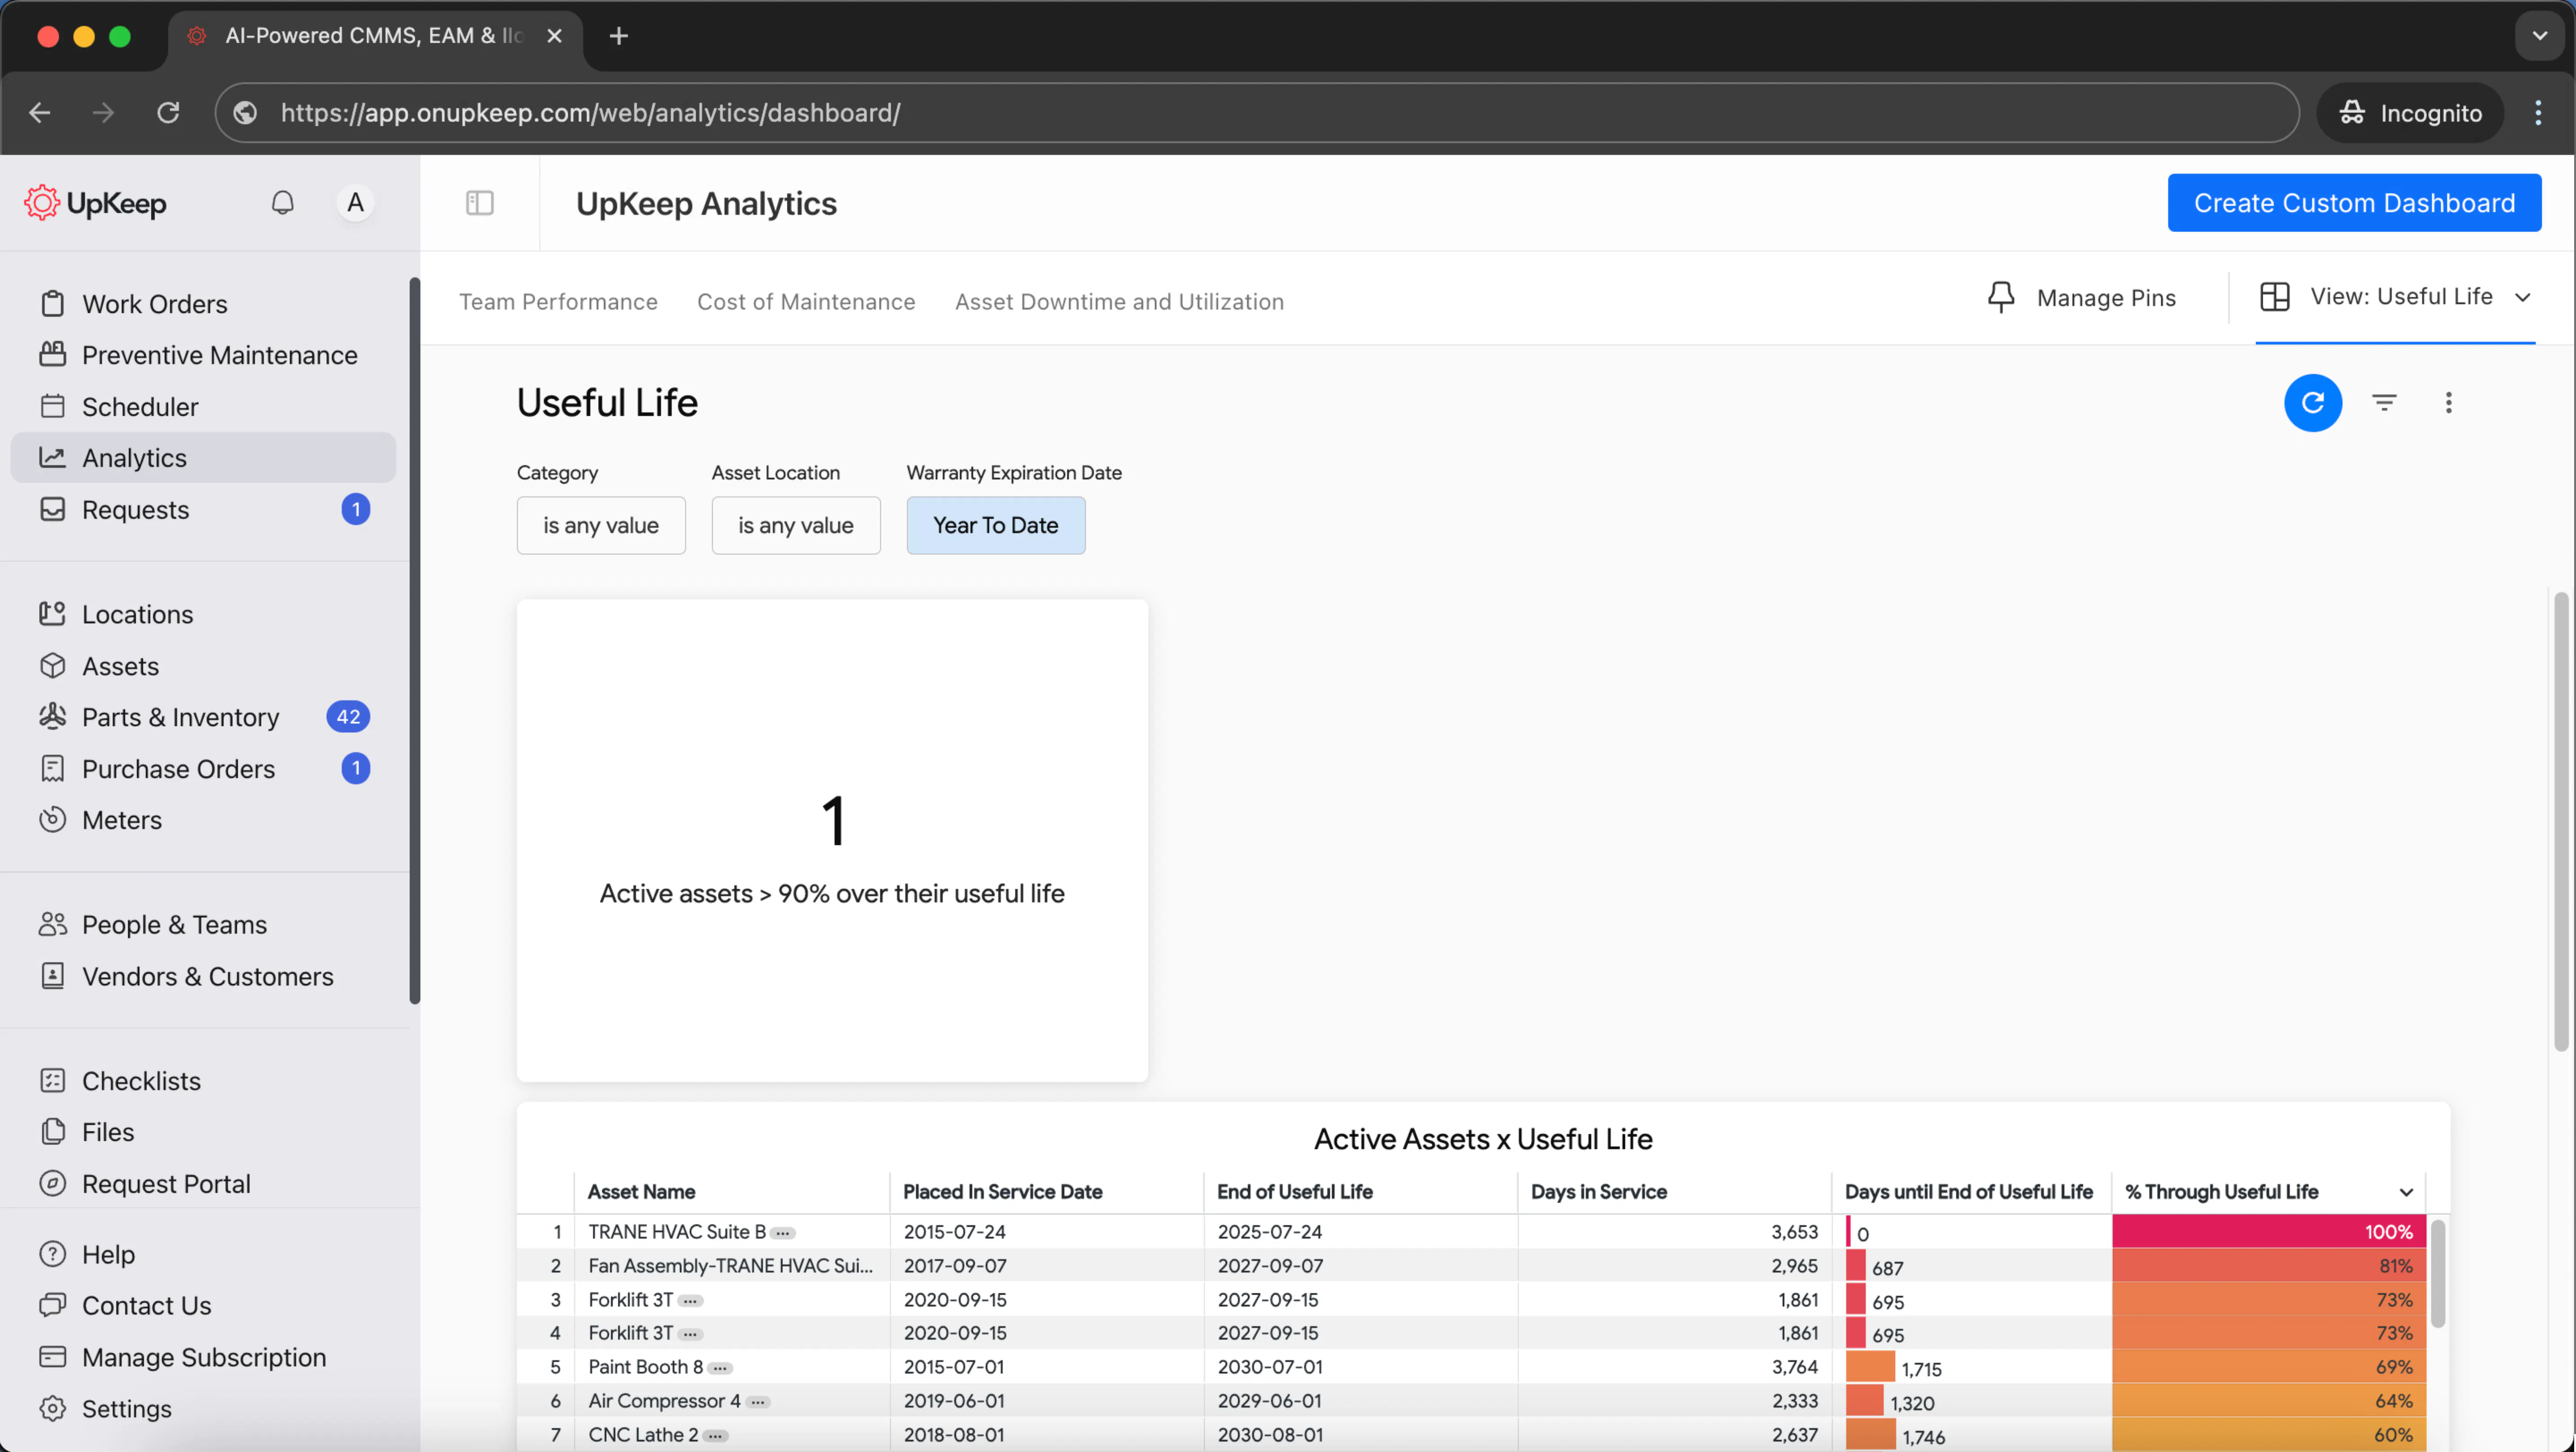
This report identifies active assets approaching the end of their useful life so you can plan replacements before failures occur.
Use this report to create replacement schedules, justify capital budget requests, and identify assets where repair costs exceed replacement value.
Data Needed:
Asset name and location/site
Asset category or type
Service start date and days in operation
Expected useful life
Purchase price and current value
Residual or salvage value
Operational status
Total maintenance costs
Maintenance cost as percentage of asset value
Build It in Upkeep
In Upkeep's report builder, configure your EOL asset report with:
Dimensions: Asset Name, Site, Category, Placed In Service Date, Days in Service, Useful Life, Purchase Price, Current Value, Residual Price, Operational Status
Measures: Asset Counts, Total Maintenance Cost, Total Cost As Pct of RAV
Filters: Operational Status = Active (to exclude retired assets)
Sorting: Days remaining in useful life (ascending) or maintenance cost percentage (descending)
3) Inventory Value & Quantity (by Site/Location/Category)

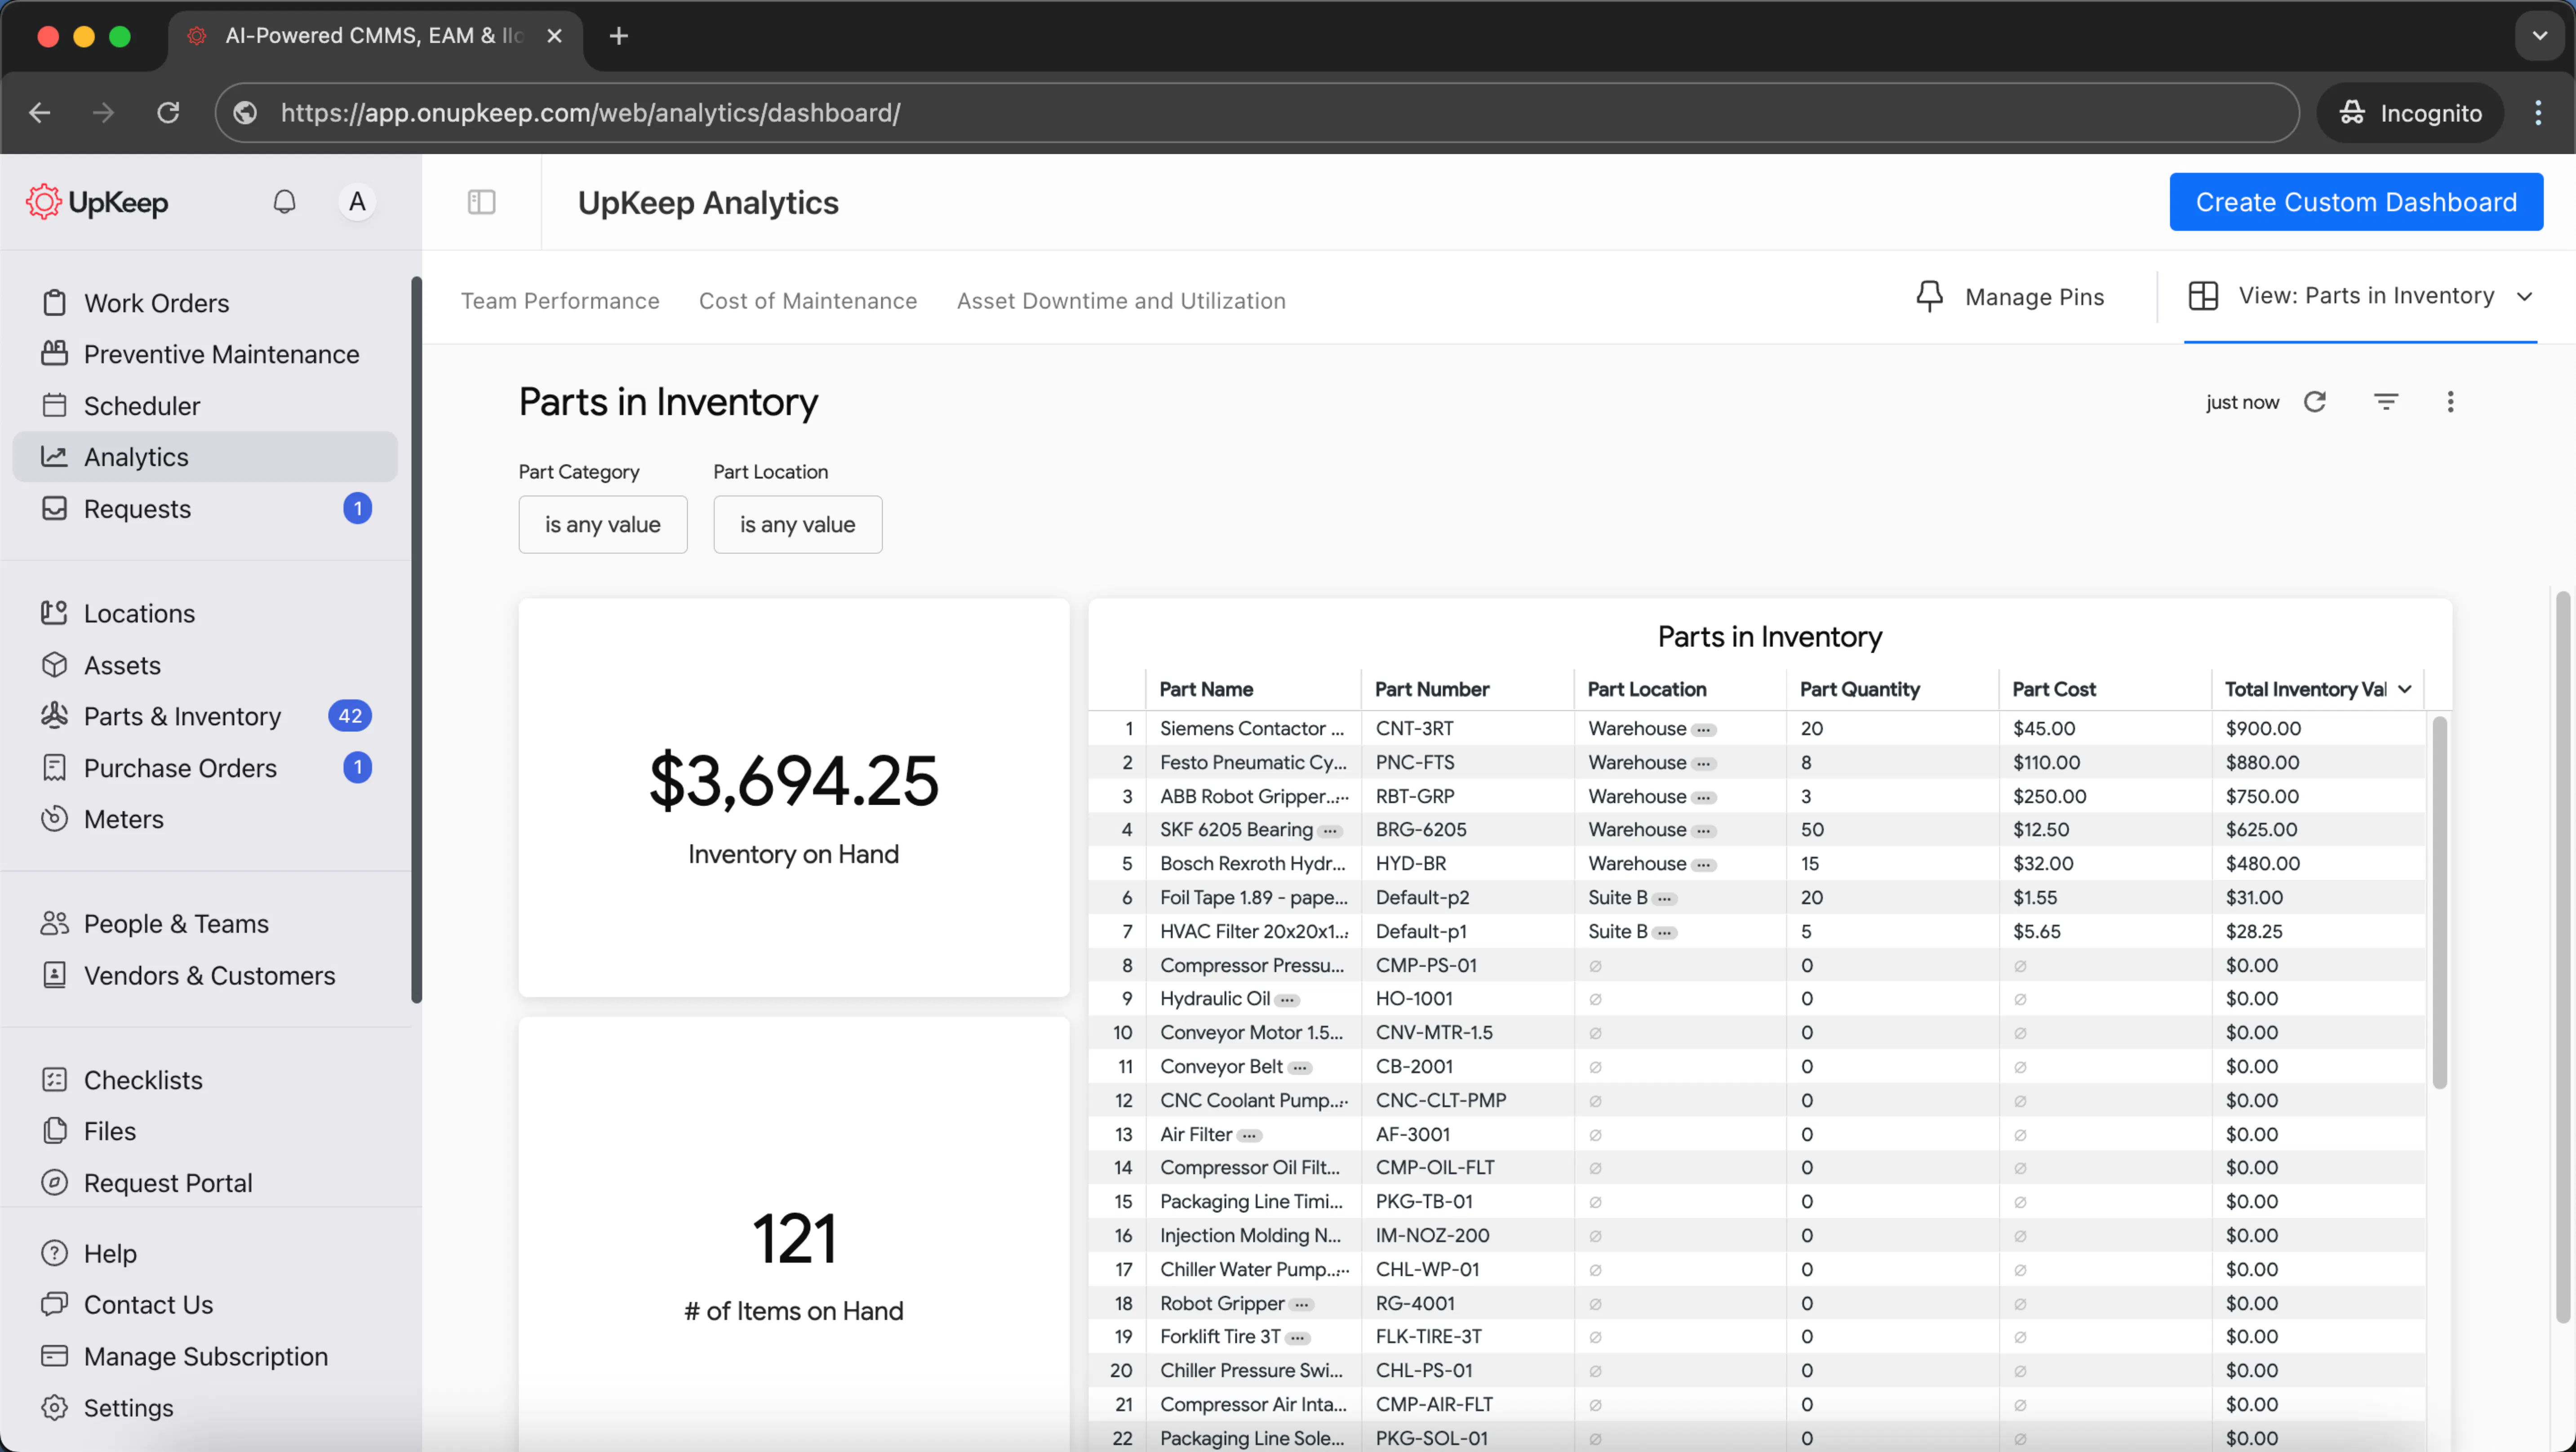
This report shows your on-hand stock levels and how much capital is tied up in spare parts across locations.
Use this report to identify overstocked parts, reduce carrying costs, optimize reorder points, and redistribute inventory between sites to prevent stockouts.
Data Needed:
Part name and part number
Part category or type
Site and storage location
Inventory status (active, obsolete, archived)
Vendor information
On-hand quantity
Unit cost and total inventory value
Aggregate quantities and values by category
Build It in Upkeep
In Upkeep's report builder, configure your inventory report with:
Dimensions: Part Name, Part Number, Part Category, Site, Part Location, Inventory Status, Vendor
Measures: On Hand Quantity, Total Inventory Value, Aggregate Part Quantity, Aggregate Inventory Value
Filters: Inventory Status = Active (exclude archived parts); On Hand Quantity > 0 (optional)
Grouping: Site → Part Location → Part Category → Part Name
Sorting: Total Inventory Value (descending), then On Hand Quantity (descending)
4) Request-to-Completion Cycle Time

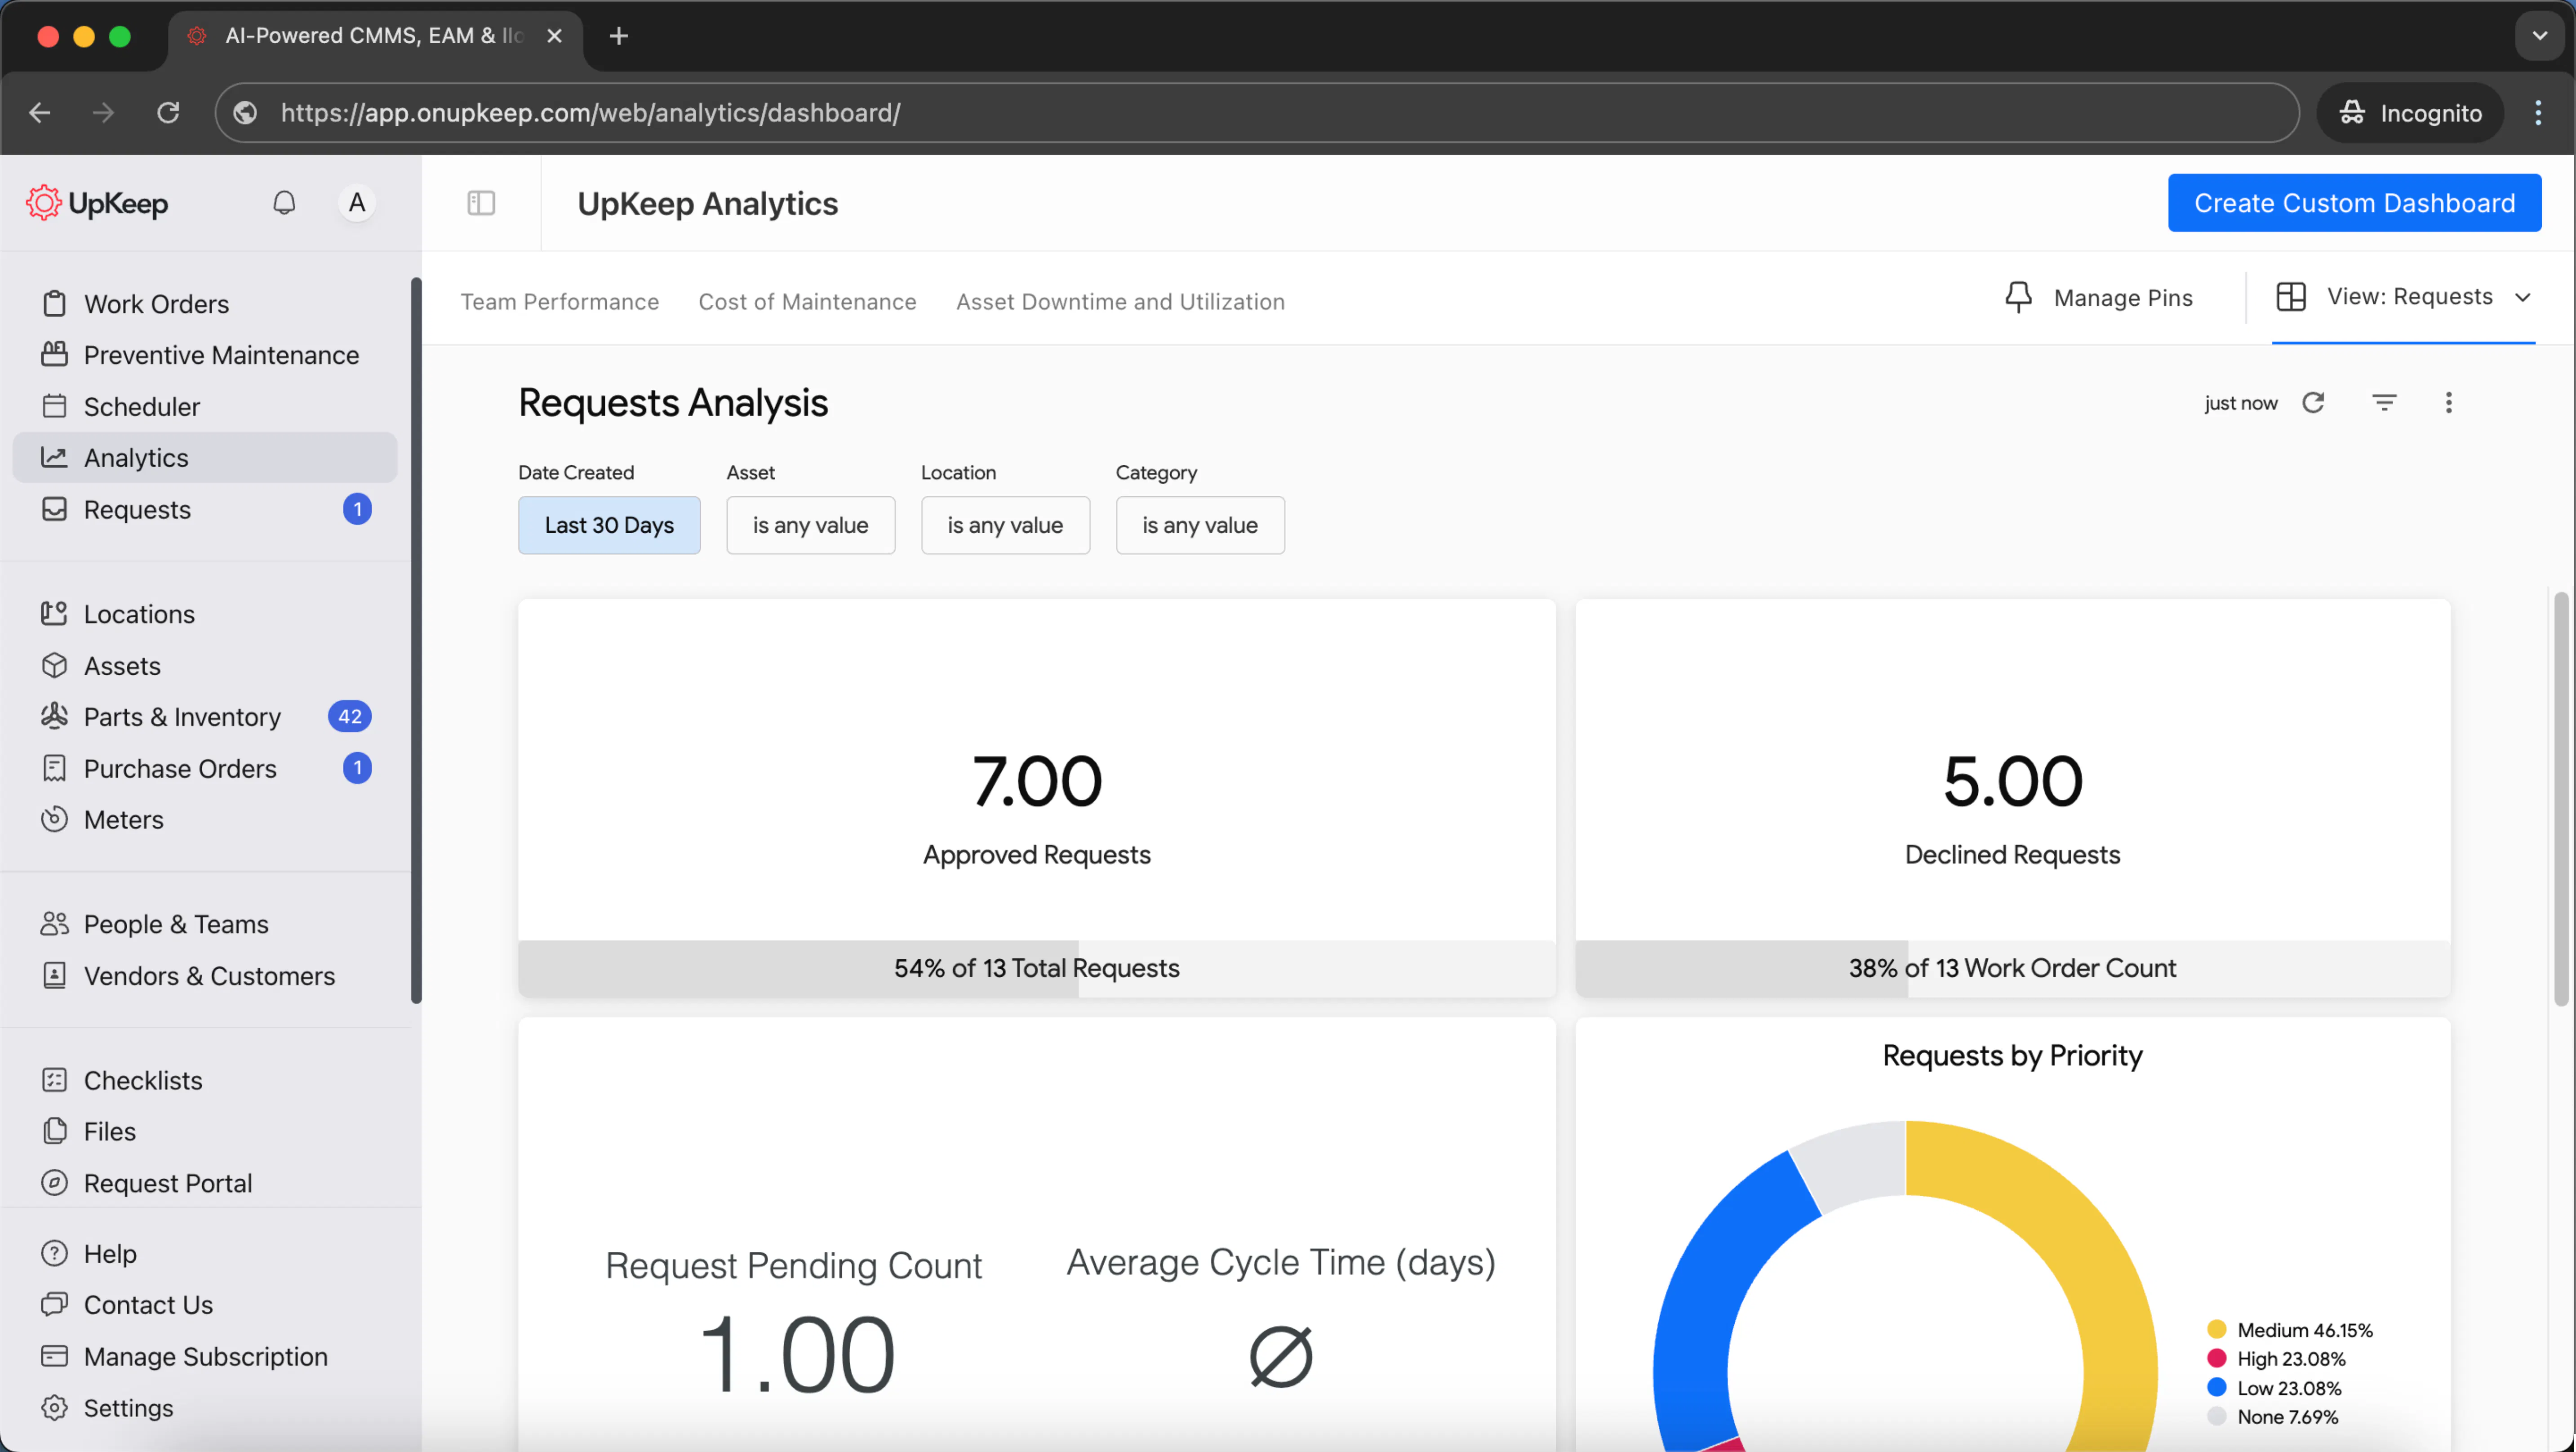
This report measures the total time from when a maintenance request is submitted until the work order is completed.
Use this report to identify workflow bottlenecks, improve response times, set realistic SLAs, and benchmark team performance across sites or categories.
Data Needed:
Site or location
Work order category or type
Assigned technician or team
Priority level
Request creation date and time
Work order completion date and time
Cycle time calculation (completion minus creation)
Total labor hours spent
Number of completed work orders
Build It in Upkeep
In Upkeep's report builder, configure your cycle time report with:
Dimensions: Site, Category, Assigned To Full Name, Priority
Measures: Average/Median Cycle Time (days/hours), Complete Count, Total Time Spent (hours)
Filters: Is Complete = True; Created Date in selected period
Grouping: Site → Category (add Priority to see expedite performance)
Sorting: Average Cycle Time (descending)
5) Requester Insights (Volume, Backlog, SLA Risk)
This report shows who submits the most maintenance requests and where those requests get stuck in your workflow.
Use this report to identify high-volume requesters who may need training, spot aging requests at risk of SLA violations, and improve communication with frequent requesters.
Data Needed:
Requester name or email
Site or location
Current request status
Request creation date
Due date or SLA deadline
Request age (days open)
Time past due
Count of pending requests
Backlog status
Build It in Upkeep
In Upkeep's report builder, configure your requester insights report with:
Dimensions: Requester Email Address, Site, Current Status, Work Order Due Date, Created Date
Measures: Count, Request Pending Count, Average Work Order Age, Time Past Due
Filters: Request Pending = Yes (for open backlog view); Created Date in selected period
Grouping: Requester Email Address → Current Status
Sorting: Time Past Due (descending), then Average Work Order Age (descending)
6) Warranty Expiration Radar

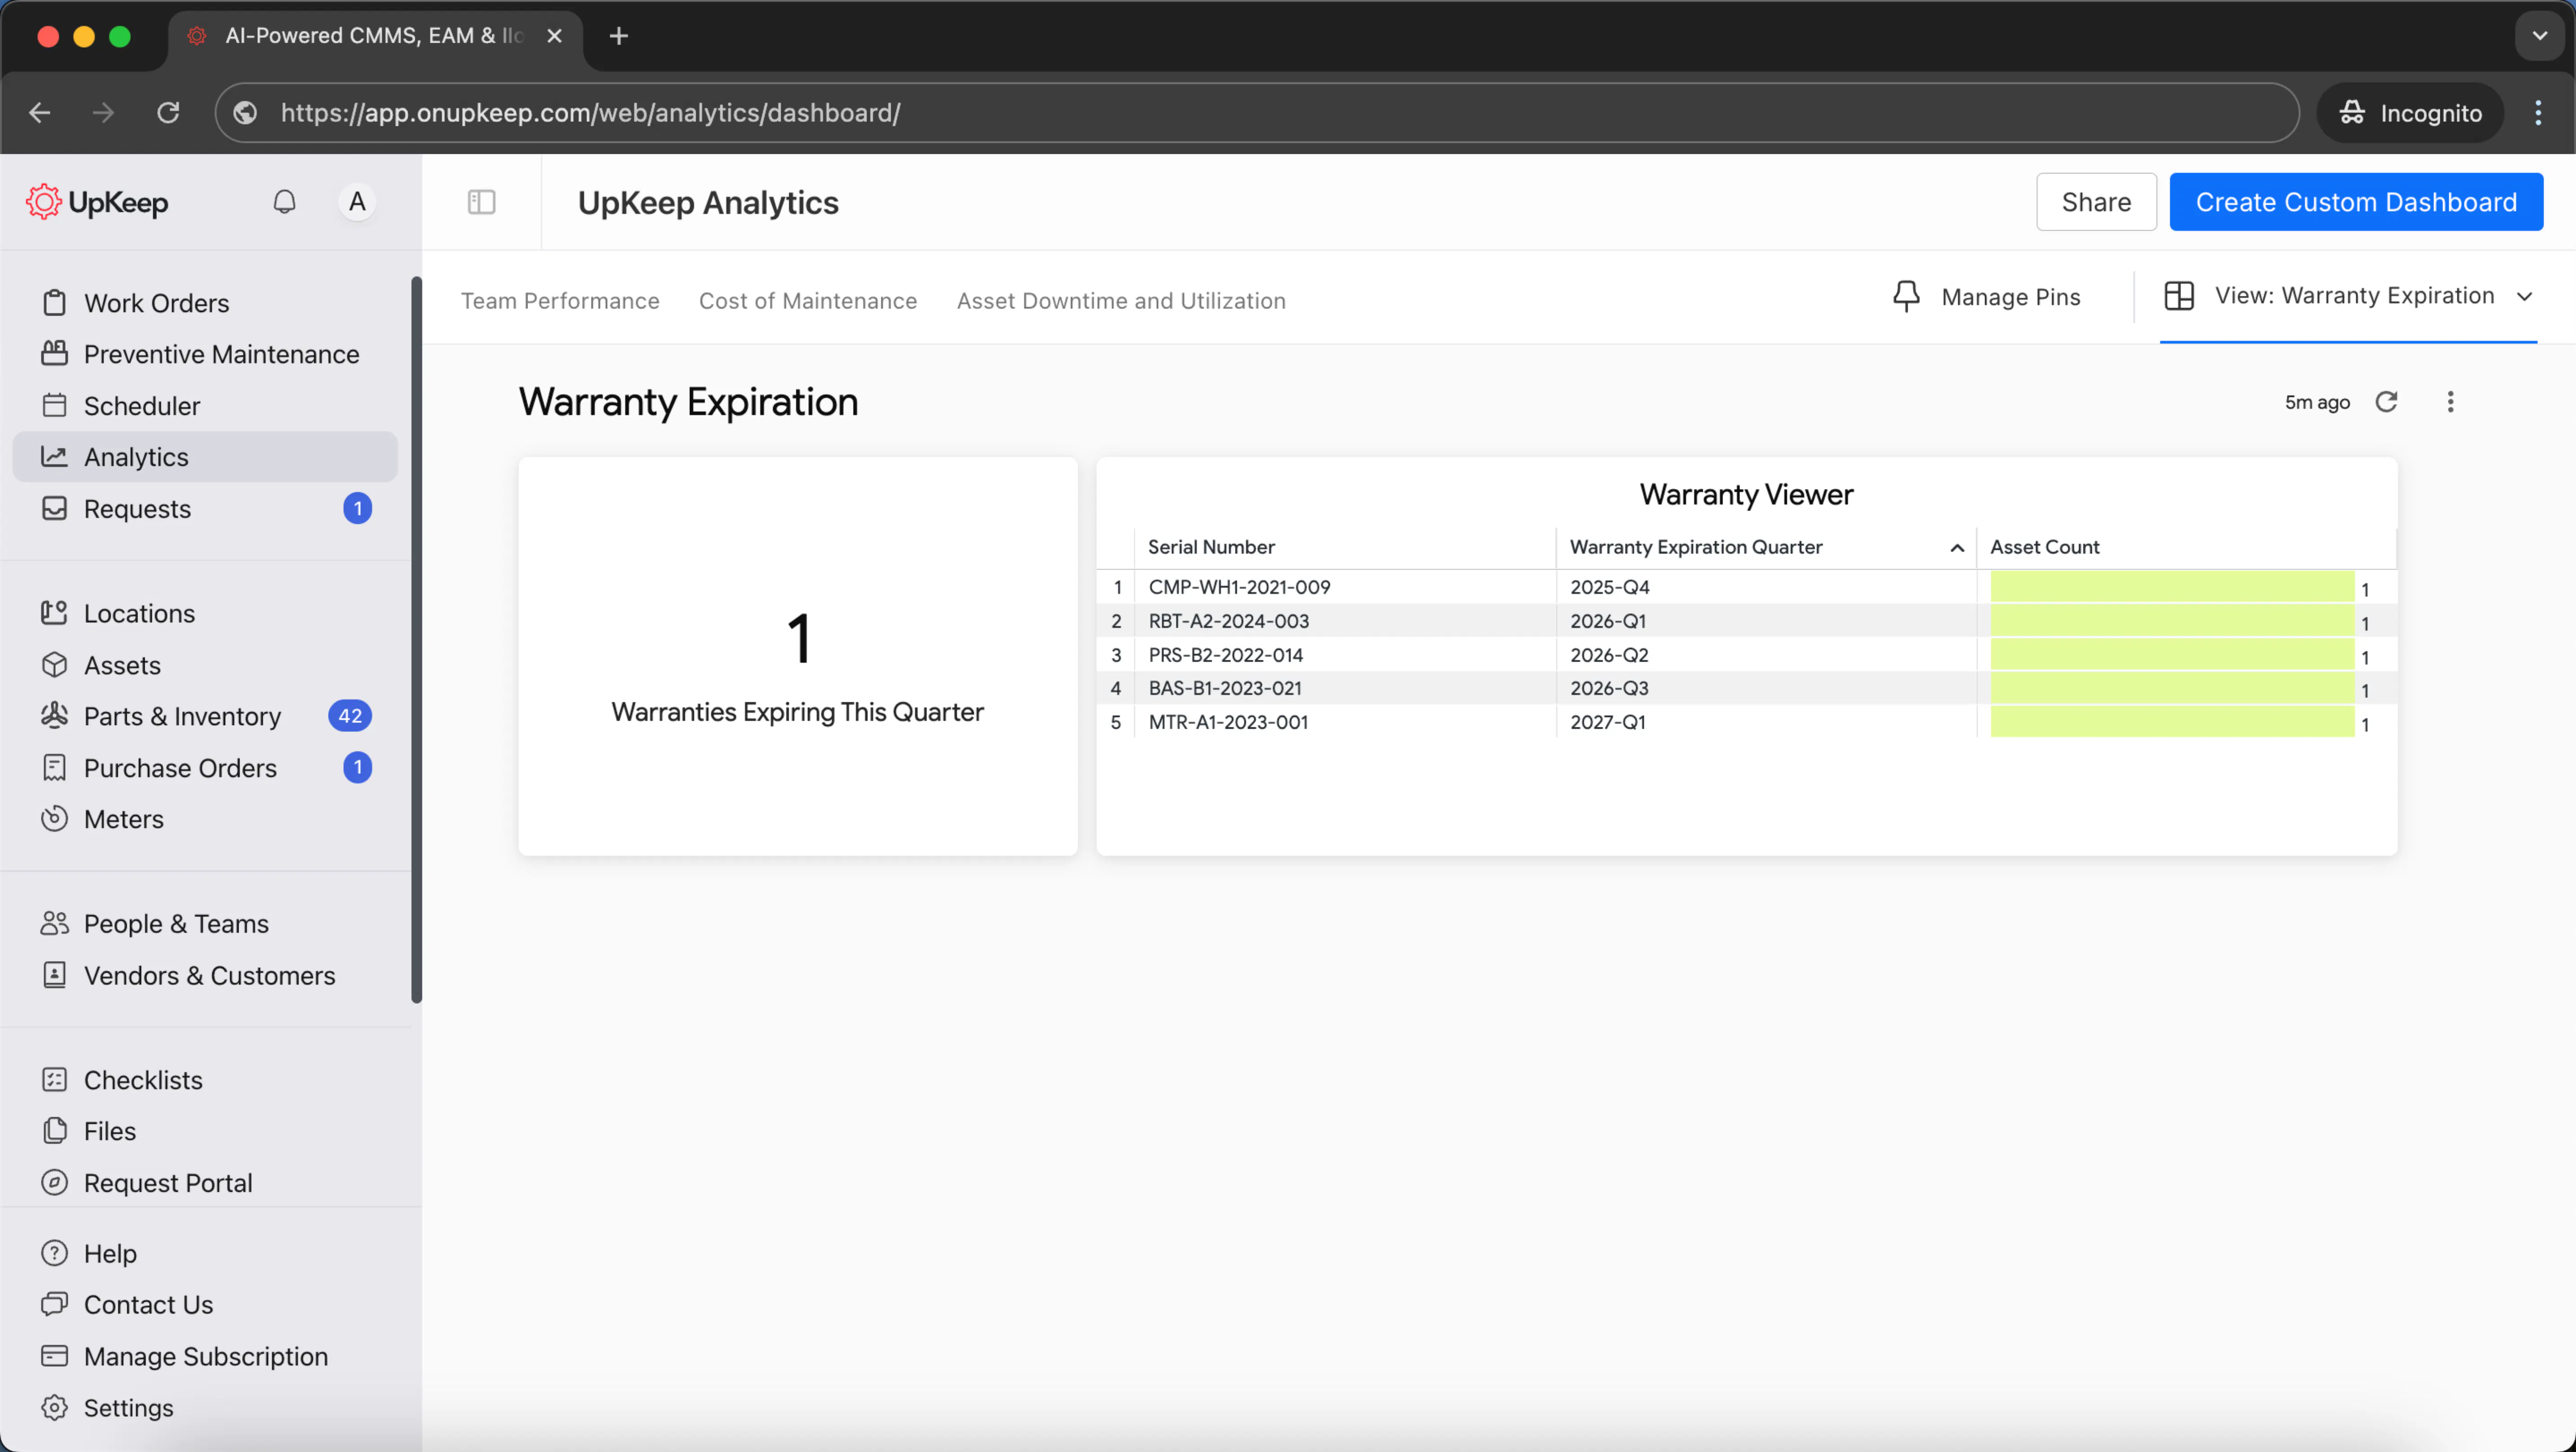
This report identifies assets with warranties expiring soon so you can file claims and schedule inspections before coverage ends.
Use this report to submit timely warranty claims for needed repairs, schedule pre-expiration inspections, negotiate extended warranties, and budget for upcoming maintenance costs.
Data Needed:
Asset name and serial number
Site or location
Manufacturer or vendor name
Purchase date
Warranty expiration date
Days until expiration
Asset count by expiration period
Build It in Upkeep
In Upkeep's report builder, configure your warranty expiration report with:
Dimensions: Asset Name, Site, Manufacturer Name, Serial Number, Purchase Date, Warranty Expiration Date
Measures: Asset Counts
Filters: Warranty Expiration Date within next 90/180 days (adjust window as needed)
Grouping: Site → Warranty Expiration Date (by month)
Sorting: Warranty Expiration Date (ascending)
7) Vendor Spend & Part Performance

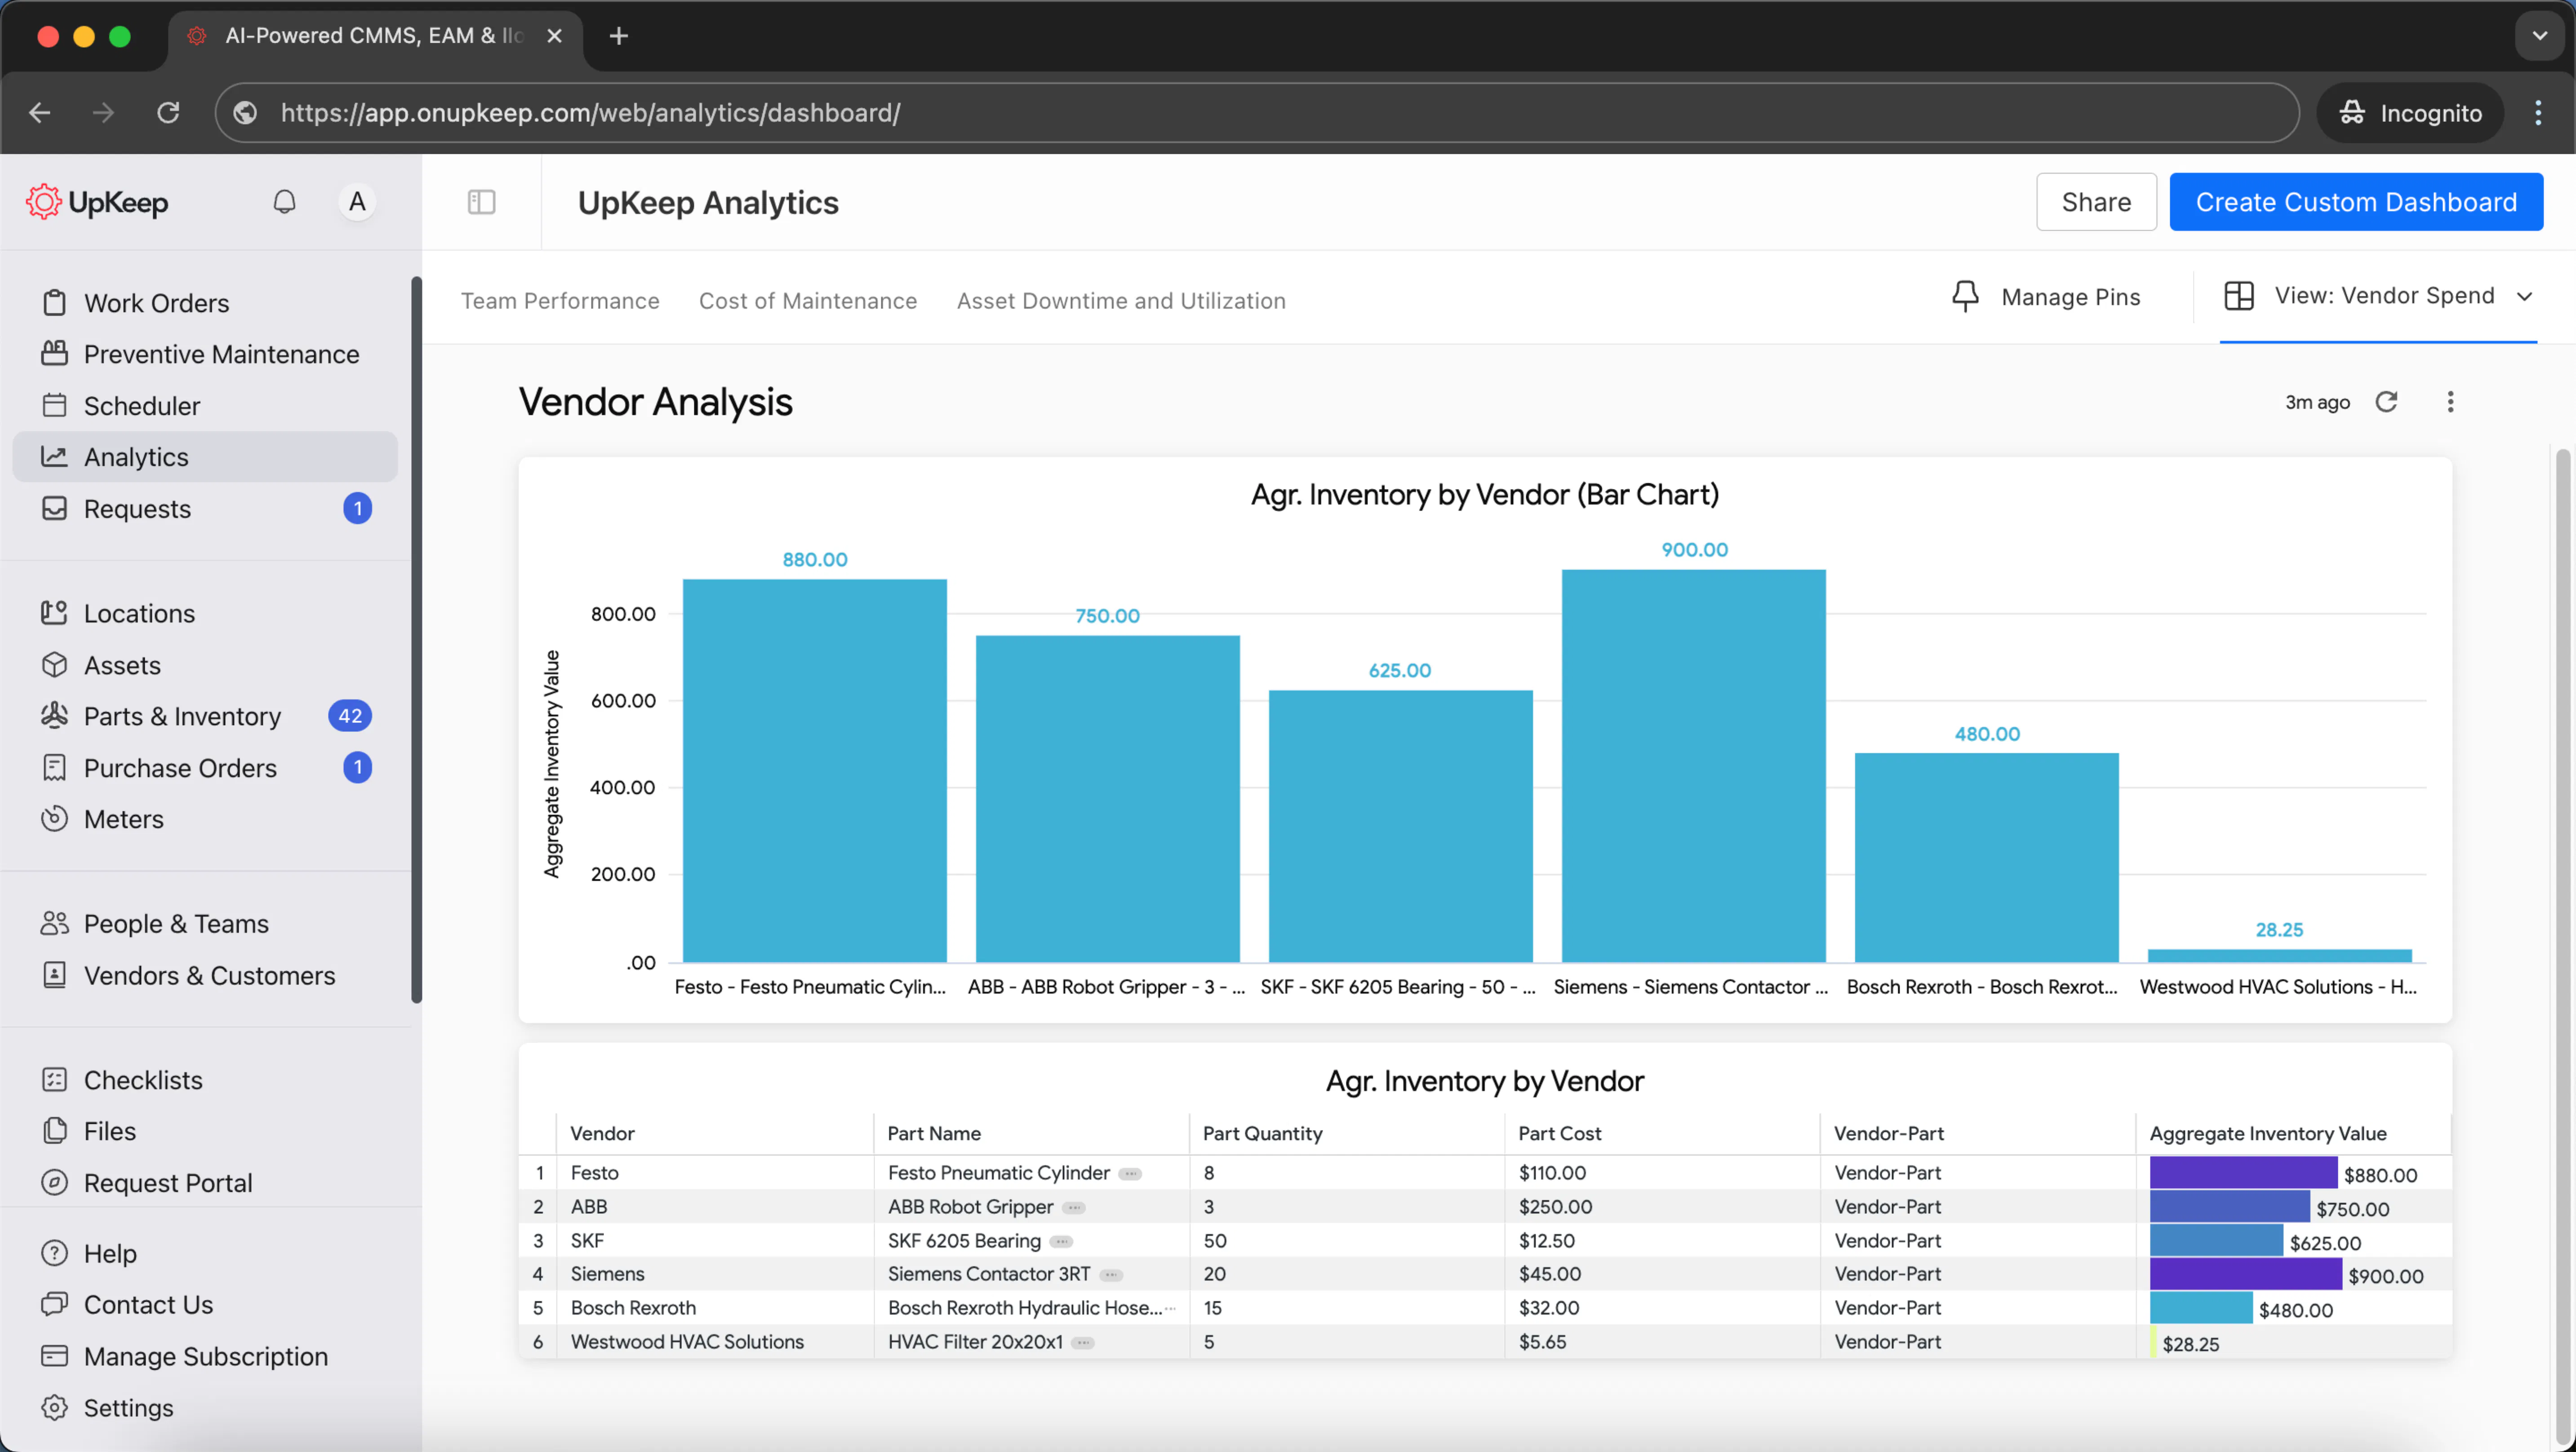
This report tracks spending by vendor and part quality to optimize your supply chain and reduce costs.
Use this report to negotiate volume discounts, consolidate vendors, identify unreliable parts, and standardize inventory SKUs across sites.
Data Needed:
Vendor name and contact info
Part name and description
Site or location
Part quantities purchased
Unit costs and total spend
Part failure rates or quality issues
Purchase dates and periods
Build It in Upkeep
In Upkeep's report builder, configure your vendor spend report with:
Dimensions: Vendors, Part Name, Site
Measures: Part Quantity, Part Cost, Aggregate Total Cost
Filters: Last quarter or half-year (adjust timeframe as needed)
Grouping: Vendors → Part Name
Sorting: Aggregate Total Cost (descending)
8) PM Compliance (Due vs. Done)
This report tracks preventive maintenance completion rates to ensure critical PMs don't get missed and equipment stays reliable.
Use this report to maintain regulatory compliance, prevent equipment failures, identify scheduling conflicts, and defend your maintenance program during audits.
Data Needed:
PM title and schedule ID
Trigger type (calendar, meter, condition-based)
Next due date
Completion status and date
Recurring work order indicator
Archive status
Count of PMs due in period
Count of PMs completed in period
Compliance percentage calculation
Build It in Upkeep
In Upkeep's report builder, configure your PM compliance report with:
Dimensions: PM Title, PM Schedule ID, Trigger Type, Next Due Date, Is Archived (from Preventive Maintenance); Is Recurring, Is Complete, Completed Date (from Work Orders)
Measures: PMs due this period (Next Due Date in period count), PM WOs completed this period (Is Recurring = Yes + Completed Date in period count)
Filters: Is Archived = No; timeframe = this month/quarter; Is Recurring = Yes (for PM-related WOs only)
Grouping: PM Title
Calculation: Compliance % = Completed / Due (export if not supported in builder)
9) Tech Productivity
This report measures individual technician output and time utilization to optimize workforce efficiency.
Use this report to balance workloads across teams, identify top performers for mentorship roles, spot training needs, and justify staffing decisions.
Data Needed:
Technician name
Site or location
Work order category or type
Current status
Time logged per work order
Total hours worked
Number of work orders completed
Completion dates
Build It in Upkeep
In Upkeep's report builder, configure your technician productivity report with:
Dimensions: Assigned To Full Name, Site, Category (WO), Current Status
Measures: Total Time Spent (hours), Count (WOs)
Filters: Created Date in last 30/90 days; Is Complete = Yes (for throughput) or All (for time in-progress)
Grouping: Assigned To Full Name
Sorting: Total Time Spent (descending)
10) Request-to-WO Funnel (Intake Health)
This report shows how efficiently maintenance requests convert into scheduled work orders, revealing bottlenecks in your intake process.
Use this report to improve request triage speed, identify approval delays, streamline intake workflows, and meet response time SLAs.
Data Needed:
Requester email or name
Site or location
Request creation date
Request status (pending, approved, rejected)
Work order conversion status
Count of pending requests
Total work orders created
Conversion rate calculation
Build It in Upkeep
In Upkeep's report builder, configure your request funnel report with:
Dimensions: Requester Email Address, Site, Created Date, Request Pending (Yes/No)
Measures: Request Pending Count, Count (total WOs)
Filters: Created Date in selected period
Grouping: Created Date (by week)
Sorting: Request Pending Count (descending)
11) Slow/No-Move Parts (Working Capital Cleanup)
This report identifies dead stock sitting in your inventory that hasn't moved in months, tying up valuable working capital.
Use this report to transfer excess inventory between sites, reduce carrying costs, and make write-down decisions for obsolete parts.
Data Needed:
Part name and ID/SKU
Site or storage location
Part category
Last movement or usage date
On-hand quantity
Unit cost and total value
Days since last movement
Build It in Upkeep
In Upkeep's report builder, configure your slow-moving parts report with:
Dimensions: Part Name, Part ID/SKU, Site, Part Category, Last Movement Date
Measures: On-Hand Quantity, Total Value
Filters: Last Movement Date ≤ (Today − 90/180 days); On-Hand Quantity > 0
Sorting: Total Value (descending)
Tips for creating better maintenance reports
Garbage in, garbage out.
Your reports are only as good as the data your techs enter. Keep your categories, site names, and asset tags consistent. Make sure your team logs their time and parts before closing work orders. Spot-check a handful of work orders weekly to keep everything clean.
Actually look at them.
A report nobody reads is worthless. Set up a routine — check backlog daily at shift meetings, review PM compliance weekly with your leads, go over costs monthly with leadership. That's how data turns into better decisions.
Focus on what matters.
Skip the fluff metrics. Track KPIs that actually improve your operations — like cutting emergency work, hitting PM schedules, or keeping maintenance costs under control. Every report should help you hit those targets.
Watch both ends.
Track results (downtime, costs) alongside the stuff you can control right now (PM completion rates, how fast you approve requests, backlog age). This combo helps you catch problems before they blow up your budget.
Let Upkeep do the heavy lifting.
Building reports shouldn't eat up your day. Upkeep captures everything — requests, work orders, time, parts — as your team works. Reports build automatically and flag issues fast, so you can focus on fixing problems instead of finding them. See our reporting dashboards in action by scheduling a demo.
FAQ
How can I create a CMMS report?
In Upkeep, open the custom report builder and pick what you want to track (Work Orders, Assets, Inventory, or Requests). Choose your dimensions (like Site, Category, Asset) and what to measure (counts, time, costs). Set your filters (dates, status, location), arrange the data how you need it, then save it to reuse. You can export or print if you need handouts for meetings. Upkeep lets you customize everything so each team gets the view they need.
Do I need a CMMS to create maintenance reports?
You can build reports in spreadsheets, but it can be tedious and mistakes are likely. A CMMS like Upkeep keeps all your work orders, assets, inventory, and requests in one place. Your techs enter data on their phones as they work, and it automatically becomes reliable reports — no more manual number-crunching that wastes hours and causes errors.
What's the difference between a CMMS report and a CMMS dashboard?
A report is a detailed, filterable/exportable view — great for audits, weekly ops reviews, or drilling into costs, time, and completion history. A dashboard is an at-a-glance snapshot of key KPIs (e.g., PM compliance, backlog, downtime) that leaders and supervisors monitor daily. Upkeep provides both: customizable reports for deep dives and dashboards for quick, role-based visibility.
MÁS DE 4000 EMPRESAS CONFÍAN EN LA GESTIÓN DE OPERACIONES DE ACTIVOS
Liderando el camino hacia un futuro mejor para el mantenimiento y la confiabilidad
Los datos de sus activos y equipos no pertenecen a un silo. UpKeep simplifica ver dónde se encuentra todo, todo en un solo lugar. Eso significa menos conjeturas y más tiempo para concentrarse en lo que importa.